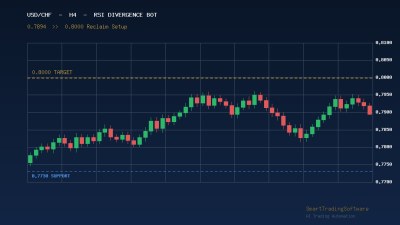
USD/CHF Builds a Base Near 0.7894 as Bulls Eye the 0.8000 Psychological Wall The USD/CHF pair is trading at 0.7894 on June 4, 2026, holding within a multi-week recovery range after slipping 0.35% from the previous session. The Swiss Franc has weakened roughly 0.81% over the past month, even though it remains up about ...
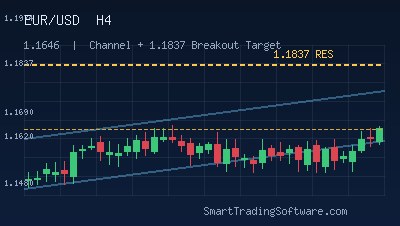
EUR/USD at 1.1646: Trend Lines Bot for 1.1840 Breakout Setup
EUR/USD at 1.1646 Coils Inside Ascending Channel Ahead of 1.1840 Test EUR/USD is trading near 1.1646 in early June 2026, holding inside the ascending channel that has guided price action higher since the March low. The 5-day moving average sits at 1.1646 and the 50-day moving average is virtually flat with it at 1.1645, ...
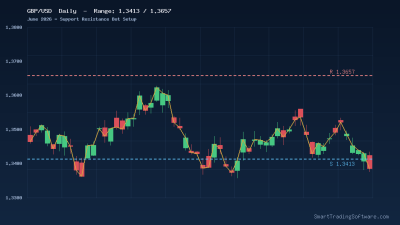
GBP/USD at 1.3450: Support Resistance Bot for 1.3657 Breakout
GBP/USD Pinned Near 1.3450: Why the 1.3657 Resistance Matters Now As of early June 2026, GBP/USD is trading around the 1.3433–1.3450 area, hugging both its 5-day moving average at 1.3433 and its 50-day moving average at 1.3430. The 14-day RSI sits at 56.4, which is constructive but far from overbought, and MACD ...
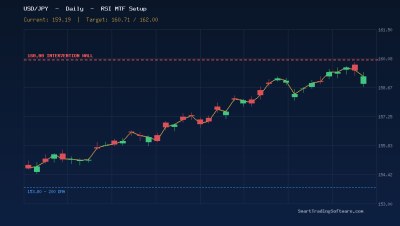
USD/JPY at 159.19: RSI MTF Bot for 160.00 Intervention Test
USD/JPY Tests the 160.00 Intervention Wall: Current Setup at 159.19 USD/JPY is once again pressing against the politically loaded 160.00 handle. As of late May 2026, the pair trades near 159.19 after recovering roughly 80% of the losses inflicted by two intervention rounds in late April and early May that reportedly ...
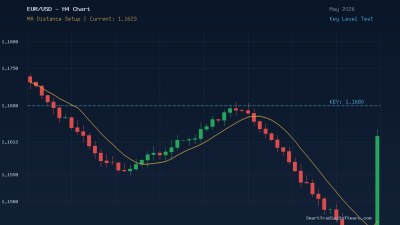
EUR/USD at 1.1623: MA Distance Indicator for 1.1680 Reclaim
EUR/USD Stalls at 1.1623 as Price Compresses Between Key Moving Averages EUR/USD is trading at 1.1623 on May 28, 2026, hovering uncomfortably between the 5-day moving average at 1.1612 and the 50-day moving average at 1.1628 . After failing to hold the pivotal 1.1680 support zone earlier this month, the single ...
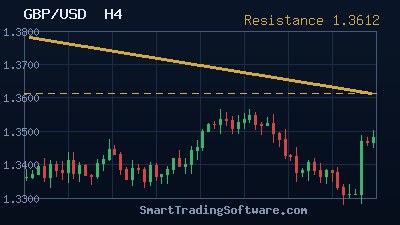
GBP/USD at 1.3480: Support Resistance Bot for 1.3612 Breakout
GBP/USD Stalls at 1.3480 as Cable Tests Major Trend Line Resistance The British pound is grinding higher against the US dollar this week, with GBP/USD trading around 1.3480 on May 26, 2026. Cable has spent the past two weeks rebuilding from the 1.3300 swing low, and the pair now sits just below a downward-sloping resistance ...
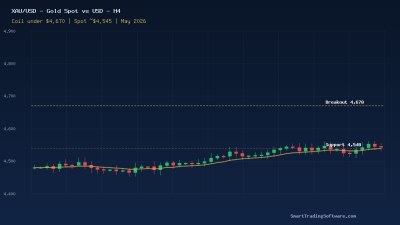
XAU/USD at $4,545: Gold Bot Setup for $4,670 Breakout Coil
XAU/USD Sits at $4,545 as Gold Coils Beneath the $4,670 Pivot Gold (XAU/USD) is grinding sideways near $4,545 per ounce in mid-May 2026, holding inside a tight consolidation that has frustrated both bulls and bears for most of the week. Spot gold ticked up about 0.10% on May 18 in low-volume trade, with the metal pinned ...
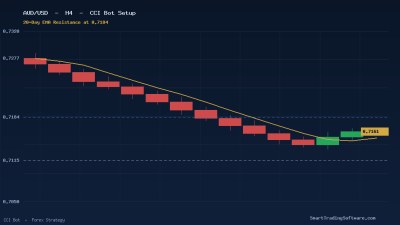
AUD/USD at 0.7161: CCI Bot Setup for 0.7184 EMA Reclaim
AUD/USD Slips to 0.7161 as 20-Day EMA Caps Recovery The Australian dollar has had a tough mid-May, drifting back to roughly 0.7161 against the greenback after stronger-than-expected US inflation reset rate-cut expectations for the second half of the year. The pair now sits just below the 20-day EMA at 0.7184 , a dynamic ...
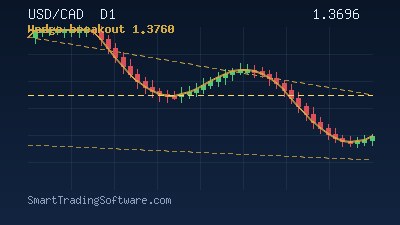
USD/CAD at 1.3696: Trend Lines Bot for Falling Wedge Breakout
USD/CAD Compresses Inside a Falling Wedge Near 1.3696 The loonie pair is hovering at 1.36962 as of mid-May 2026, caught between a multi-week downtrend and an increasingly visible falling wedge structure on the daily chart. Since early April, USD/CAD has corrected steadily lower from the 1.3920 zone, but bears have failed ...
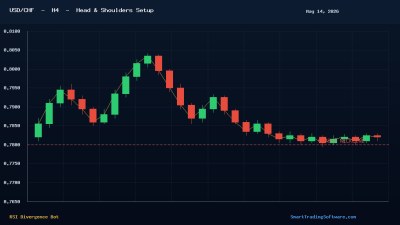
USD/CHF at 0.7820: RSI Divergence Bot for H&S Breakdown Setup
USD/CHF Tests 0.7800 Neckline as Head and Shoulders Pattern Awaits Confirmation USD/CHF is trading near 0.78204 in the European session on May 14, 2026, putting traders on high alert as the pair tests the 0.7800 psychological neckline of a clearly defined head and shoulders pattern on the four-hour chart. After topping ...
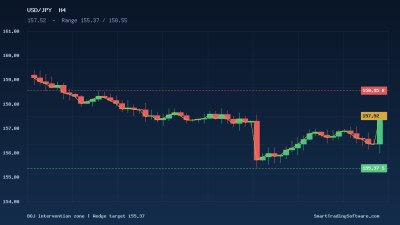
USD/JPY at 157.52: Support Resistance Bot Range Strategy
USD/JPY at 157.52: Range-Bound Setup Tested by BOJ Intervention Risk USD/JPY is trading near 157.52 in mid-May 2026 after a turbulent stretch defined by suspected Bank of Japan intervention. The pair has been compressed inside a 157.59–160.46 consolidation range since mid-March, and recent action has produced a ...
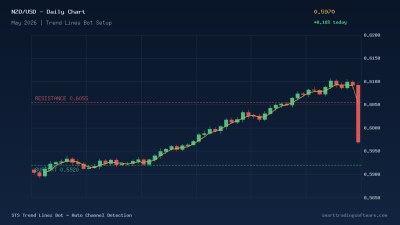
NZD/USD at 0.5970: Trend Lines Bot for 0.6055 Resistance Test
NZD/USD at 0.5970 Eyes 0.6055 Resistance as Kiwi Builds Momentum After RBNZ Hold The New Zealand dollar has been one of the standout performers across the G10 board in 2026, climbing roughly 7% from its February low near 0.5710 to a recent peak just under the 0.6100 handle. As of mid-May 2026, NZD/USD trades around the ...
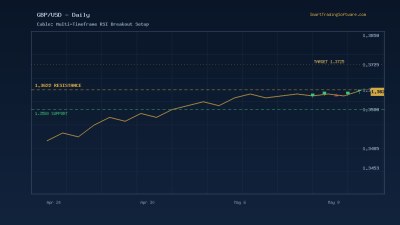
GBP/USD at 1.3620: RSI MTF Bot for 1.3725 Cable Breakout
GBP/USD Tests 1.3622 Pivotal Resistance as Cable Eyes 1.3725 Projection Cable has clawed its way back to the 1.3620 region, knocking on the door of the pivotal 1.3622 resistance level after closing higher on May 8, 2026. The pair printed 1.3620 at the latest session, up roughly 0.60% on the day, and the path of least ...
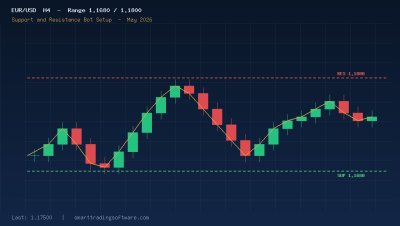
EUR/USD at 1.1750: Support Resistance Bot for 1.18 Breakout Setup
EUR/USD Tests 1.18 Resistance After Holding 1.1680 Support EUR/USD is consolidating near 1.1750 in early May 2026, trading inside a well-defined range that has formed after the pair recovered from the March low at 1.1476. Price has held firmly above the 1.1680 confluence zone, where prior support and the 200-day moving ...
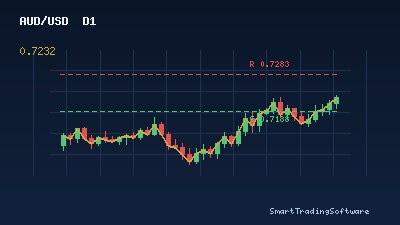
AUD/USD at 0.7232: Trend Lines Bot for 0.7283 Breakout
AUD/USD Holds Bullish Momentum Above 0.7200 as Aussie Targets 0.7283 Resistance The Australian Dollar continues to display constructive momentum against the US Dollar, with AUD/USD trading near 0.7232 in early May 2026. The pair is attempting to break above a multi-day consolidation phase, with bulls eyeing the 0.7283 ...
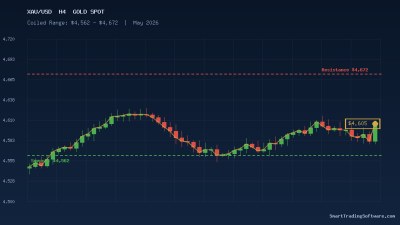
XAU/USD at $4,605: Gold Bot Strategy for $4,672 Resistance Test
XAU/USD Tests $4,605 Pivot as Gold Coils Beneath $4,672 Resistance Gold opens May 2026 at a technically charged level. Spot XAU/USD is trading near $4,605, sitting almost exactly on the 0.382 Fibonacci retracement of the rally from late 2025 lows up to the February all-time high of $5,418.14. Above price, sellers continue ...
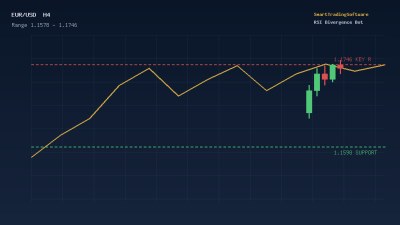
EUR/USD at 1.1746: RSI Divergence Bot Setup for 1.1598 Support Test
EUR/USD Stalls at 1.1746 Resistance: Bearish Divergence Brewing EUR/USD enters May 2026 consolidating near 1.1746, a critical resistance zone defined by the 2026 yearly open, the 2025 high-week close, and the 2025 high-close. After the European Central Bank's recent rate decision, the euro pushed higher but the advance ...
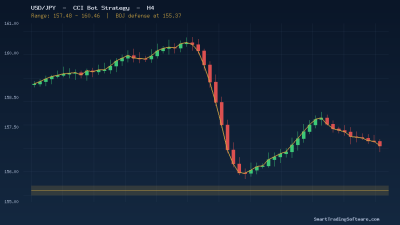
USD/JPY at 157.50: CCI Bot Strategy for 155.37 Bearish Target After BOJ Move
USD/JPY at 157.50: A Yen Caught Between BOJ Intervention and a Stretched Dollar USD/JPY has spent the opening days of May 2026 under heavy two-way pressure, with spot now trading around 157.50 after one of the most aggressive Bank of Japan interventions in over a year. The pair had spent most of late March and April ...
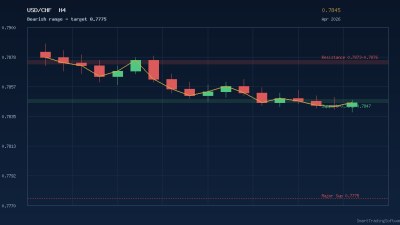
USD/CHF at 0.7845: RSI Divergence Bot Setup for 0.7775 Bearish Move
USD/CHF Slips to 0.7845 as Swiss Franc Strength Pressures the Dollar USD/CHF has spent the final week of April 2026 trading inside a tight, downward-sloping range, with spot recently changing hands near 0.7845 . The pair entered the week with a clearly bearish daily structure, a sequence of lower highs from the 0.8070 ...
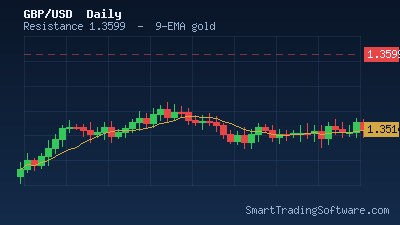
GBP/USD at 1.3514: RSI MTF Bot Strategy for 1.3599 Breakout
GBP/USD Holds Above the 50-Day MA as Bulls Eye 1.3599 Resistance Cable opened the final week of April 2026 trading near 1.3514 , consolidating for a second consecutive session inside the ascending channel that has framed the rally off the March low at 1.3162. The pair is squeezed between the 9-day EMA at 1.3509 and the ...