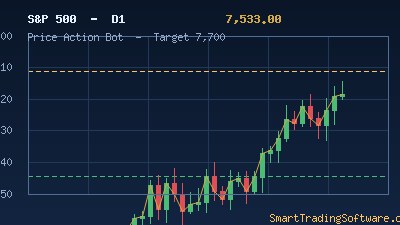
S&P 500 Slips to 7,533 After Tech Earnings Disappoint
The S&P 500 is trading at 7,533 on June 4, 2026, easing 0.28% from the prior session after a sharp tech-led pullback. Broadcom collapsed nearly 14% on a Q2 revenue miss and CrowdStrike sank more than 11% on soft guidance, dragging the broader index off the fresh all-time high of 7,609.78 printed only two sessions earlier on June 2. Despite the slip, the structural picture is still firmly bullish: the benchmark is sitting well above its 50-day moving average at 7,100.11 and its 200-day moving average at 6,842.20, with 12 of 12 short and long-term moving averages still flashing buy signals.
Momentum tools, however, are sending the first early caution signals. The 14-day RSI is parked at 75.04, deep into overbought territory and well past the 70 threshold most swing traders watch for mean reversion. The MACD is still positive at +19.4 but the histogram is beginning to flatten as price stalls beneath the 7,600 ceiling. That combination — an intact uptrend with stretched momentum at horizontal resistance — is the textbook environment where price action setups outperform pure trend-following systems.
Why a Price Action Strategy Fits the Current S&P 500 Tape
When an index has rallied roughly 20% in two months (the SPX bottomed near 6,343.73 on March 30 before climbing through April and May on AI capex enthusiasm), the cleanest re-entries rarely come from continuation breakouts. They come from a controlled retest of broken resistance, a higher low against a rising trend line, or an engulfing bar at a confluence zone. Reading those bar-by-bar signals manually is exhausting on a 24/5 futures market like ES, which is exactly the gap our Price Action Bot is built to close.
The bot codifies a small library of high-probability patterns — pin bars, inside bars, bullish/bearish engulfings, and three-bar reversals — and only fires when the pattern lines up with a pre-defined structural level. For the current S&P 500 setup, that means waiting for a clean reversal candle in the 7,300–7,400 demand zone rather than chasing the index near 7,600.
Suggested Long Entry Parameters
Wait for a bullish engulfing or pin bar to close inside the 7,300 to 7,400 zone, which aligns with the rising 20-day moving average and prior consolidation shelf from mid-May. Trigger entry on the break of the signal bar's high. Place the protective stop one ATR below the signal bar's low, typically 80 to 110 points on the daily chart given current realized volatility. The first take-profit target sits at the 7,600 prior high, with a runner toward the 7,700 measured-move objective. Risk-to-reward at the trigger comes out near 1:2.5, which is well inside the threshold the Price Action Bot requires before opening a trade.
Bearish Invalidation
If price closes a daily candle below 7,300 with expanding volume, the immediate long thesis is off and attention shifts to the next demand pocket at 7,000–7,050, where the 50-day moving average will likely have caught up by then. A break of 7,000 would put the larger April low at 6,343 back into focus, but that is not the base case while breadth remains supportive.
Automating the Setup Removes the Hardest Part: Patience
The single biggest reason discretionary traders fail this type of setup is that they cannot wait three or four sessions for price to actually reach the level. By the time the bullish engulfing prints at 7,350, they have already chased a breakout at 7,580 and burned through their risk budget. Letting an algorithm sit on the level eliminates the temptation. The Price Action Bot can monitor the SPX, ES futures, and SPY ETF in parallel without fatigue, and only fires when its multi-bar pattern filter and ATR-based volatility filter both align.
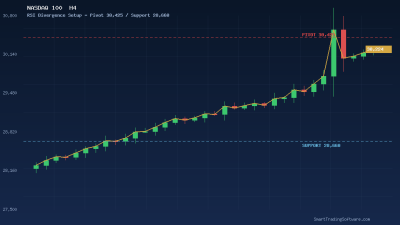
For traders who prefer to layer in confluence, pairing the price action signal with the RSI Divergence Bot adds a second layer of confirmation. A bullish RSI divergence printing into the 7,300 retest, combined with a price-action reversal candle, would be one of the higher-conviction long signals the indices market produces all year.
Key Levels to Watch This Week
Immediate resistance is 7,609 (the June 2 ATH) and then the round 7,700 figure, which is also the upper extension of the April-to-May Fibonacci move. On the downside, 7,500 is the first intraday pivot — a level the cash index has now defended twice in a week. Below that, 7,300 is the must-hold structural support, followed by 7,100 (50-day MA) and 7,000 (psychological round number). A weekly close above 7,650 would unlock a fresh measured move to roughly 7,900–8,000, the upper band of most sell-side year-end targets.
Getting Started With the Price Action Setup
Traders who want to deploy this configuration on a MetaTrader 4 or MetaTrader 5 account can follow the steps below:
- Install the Price Action Bot on your MT4/MT5 terminal and attach it to the US500 (SPX) cash CFD chart on the H4 and D1 timeframes.
- Configure the demand zone parameter to 7,300–7,400 and the supply zone to 7,600–7,700, then enable the ATR stop module with a 1.0 multiplier.
- Backtest the configuration on the past six months of SPX data using the Indicators Tester to confirm the win-rate, average R-multiple, and maximum drawdown before going live.
- Start with a 0.5% per-trade risk allocation; scale to 1.0% only after the bot prints 20 closed trades on the demo account with results inside one standard deviation of the backtest expectation.
The S&P 500 has spent two months rewarding bulls, but the next 200 points are unlikely to come in a straight line. Letting a rules-based price action engine do the waiting — and the entry — is the cleanest way to participate in the next leg toward 7,700 without giving back gains on every overbought wobble. If you want help calibrating the bot's parameters for your account size and broker spread, our trading team is one click away on the contact page.