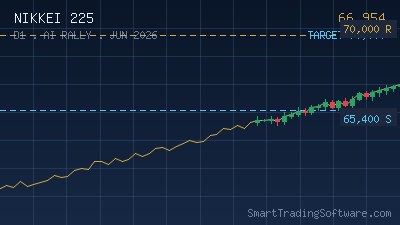
Nikkei 225 Smashes 66,954: AI Rally Eyes Historic 70,000 Milestone
The Nikkei 225 punched out a fresh record high at 66,954 on June 1, 2026, adding 0.94% (624 points) as the AI-driven rally continued to lift Japanese equities into uncharted territory. The move was led by SoftBank (+14.99%), Murata Manufacturing (+10.18%), and Sumco (+9.16%), a clear signal that semiconductor and AI infrastructure names remain the primary engine behind the index's relentless climb from the 54,000 base earlier this spring.
Short-term momentum has shifted decisively bullish after the breakout above 67,000 came within reach on Monday's session, with a new structural uptrend now targeting the psychologically important 70,000 resistance over the coming days. The combination of a still-weaker yen, robust semiconductor demand from data center build-outs, and surprisingly resilient domestic earnings has given trend-following systems a textbook environment to operate in.
The 70,000 Trend-Following Setup Explained
From a pure price-action standpoint, the Nikkei is now riding a clean ascending channel that has held its lower trendline for more than seven consecutive weekly closes. The 20-day moving average sits near 65,400 and is sloping aggressively upward, while the 50-day MA at roughly 62,800 has flattened any sign of a deeper retracement. RSI on the daily timeframe is above 70, which traditionally screams "overbought," but in a confirmed trend that reading often persists for weeks before any meaningful pullback.
The setup we want to trade is a continuation breakout: buy strength above the immediate resistance shelf at 67,200 with an extended target near 70,000, while protecting against a potential mean-reversion move back to the rising 20-day MA.
Entry Zone
Look for daily closes above 67,200 with expanding volume on the cash futures (NK225M). Aggressive traders can pyramid into a second position on any pullback that holds above the prior breakout zone of 66,400–66,600 without a daily close back below.
Stop Loss Placement
Place the initial stop at 65,300, just under the rising 20-day MA. A daily close beneath that level would invalidate the immediate trend-continuation thesis and likely open the way for a deeper test of the 62,800 area.
Take Profit Targets
Scale out in three tranches: first partial at 68,500 (measured move from the May consolidation), second at 69,400, and trail the final position toward 70,000. If price prints a clean weekly close above 70,000, the next Fibonacci extension projects a stretch target near 72,300.
Why Automating the Trend Beats Discretionary Chasing
The hardest part of trading a vertical AI-fuelled rally is execution discipline. Most discretionary traders either get shaken out on the first 1.5% intraday wobble or, worse, hesitate to add when the trend extends because the chart "looks too extended." A trend-following expert advisor solves both problems by mechanically managing entries, stops, and trail logic around defined trendlines and moving averages.
Our Trend Lines Bot is purpose-built for exactly this market condition: it auto-detects ascending and descending trendlines on the chart, fires entries on confirmed breakouts, and trails the position behind the active trendline so you stay in the move as long as the structure holds. For traders who want a slower confirmation filter that uses moving-average distance to gate entries during overextensions, the MA Distance Indicator overlays cleanly with the same logic and prevents chasing into vertical RSI prints.
Key Levels to Watch on the Nikkei 225
Heading into the next two weeks, the structurally relevant lines on the chart are tight:
Resistance: 67,200 (immediate breakout shelf), 68,500 (first measured move), 69,400 (Fibonacci 1.272 extension), 70,000 (psychological + analyst consensus target), 72,300 (next extension if 70k breaks on a weekly close).
Support: 66,400 (prior session pivot), 65,400 (rising 20-day MA), 62,800 (50-day MA + prior consolidation top), 60,000 (major psychological level and confluence with prior breakout from April), 54,300 (multi-month structural support from early spring).
A weekly close back below 65,400 would be the first warning that the trend is losing power; a break of 62,800 would shift our framework from continuation to "wait and reassess." Until then, the path of least resistance remains higher.
Getting Started with the Nikkei 225 Trend Setup
If you want to put this setup to work without staring at the chart all day, here is the practical sequence we recommend:
1. Open MetaTrader 4 or MetaTrader 5 and load the Nikkei 225 (JP225, NKY, or NK225 depending on your broker symbol) on the H4 and Daily timeframes.
2. Install the Trend Lines Bot on the Daily chart to capture the swing structure, then optionally run it on H4 for tighter entries on continuation pullbacks.
3. Overlay the MA Distance Indicator to filter out entries when the index is more than two standard deviations away from the 20-MA — this avoids chasing parabolic blow-off spikes.
4. Before going live, backtest the configuration over the last three months on the Indicators Tester to validate that the trail and entry combination would have captured the May leg from 60,000 to 66,954.
5. Start with conservative position sizing (no more than 0.5% account risk per trade) until you see at least 10 closed trades and a stable equity curve.
Have a question about configuring the Trend Lines Bot for your specific Nikkei broker symbol, or want to discuss whether this setup fits your risk profile? Reach out via our contact page and our team will help you get it dialled in before the next leg toward 70,000.