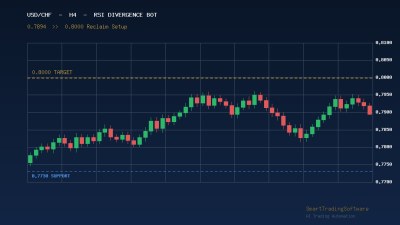
USD/CHF Builds a Base Near 0.7894 as Bulls Eye the 0.8000 Psychological Wall
The USD/CHF pair is trading at 0.7894 on June 4, 2026, holding within a multi-week recovery range after slipping 0.35% from the previous session. The Swiss Franc has weakened roughly 0.81% over the past month, even though it remains up about 3.73% over the last twelve months. That mix tells you a lot about where the pair sits: a dollar that is firm but range-bound, a Franc that is no longer the relentless safe-haven of late 2025, and a chart that is coiling tighter as price compresses between a clearly defined resistance cluster above and a critical pivot zone below.
For systematic traders, this is exactly the kind of structure that rewards a disciplined, indicator-driven approach. The dollar bid is intact, the SNB is still walking the policy tightrope around Eurozone disinflation, and volatility has compressed into a range that begs for a momentum trigger. The big question is whether the next leg is a true trend reversal toward 0.8000 or another rejection back into the 0.7730 demand zone. RSI divergence is the cleanest way to lean into that question without guessing.
The Setup: RSI Divergence Inside a Compressing Range
USD/CHF spent most of March in a downtrend that flushed to a yearly low-week close near 0.7730. From there, buyers rebuilt the base, and the recovery has now stretched into a multi-week consolidation that has tagged the H4 200-period moving average at 0.7887 and traded just above it. The recovery has raised the prospect of a broader trend reversal, but bulls still need to clear a stacked weekly resistance band near 0.7927/35 — a confluence of the 2026 yearly open, the 61.8% retracement of the March decline, and the 52-week moving average. Above that, the path opens to the yearly high-week close at 0.8009 and the January high at 0.8041.
The reason RSI divergence works so well here is that the consolidation is producing repeated micro-swings between 0.7810 and 0.7920. Each test of resistance or support is leaving a fingerprint on momentum. Bearish divergences at 0.7920 have signaled the recent rejections; the next bullish divergence at 0.7810 or 0.7769/72 would be the trigger to position long with risk against the 0.7730 LWC.
Entry, Stop, and Target Parameters
For an automated long, the cleanest framework is a confirmed bullish RSI divergence on the H4 timeframe inside the 0.7810–0.7772 demand zone, paired with a price-action confirmation candle. Entry is on the close of the confirmation bar. Stop-loss sits below the 0.7730 yearly low-week close, with a small buffer for noise — around 0.7710. First take-profit at 0.7887 (the H4 200 MA), second at 0.7920, and a runner toward the 0.7995–0.8009 zone where the psychological 0.8000 round number lines up with the yearly HWC.
For a short setup, the trigger is the opposite: a bearish RSI divergence printed against 0.7920 or 0.7935 with no follow-through above 0.7950. Stop above 0.7960. First target back at 0.7810 monthly open, second at 0.7772, with a runner toward 0.7730. The risk-reward in both directions sits comfortably above 1:2.5, which is the threshold most systematic traders need before letting a bot fire live.
Why Automate This Setup
The honest answer is that RSI divergence is brutal to trade manually. The signals form slowly across several bars, you have to compare two pivots on price against two pivots on RSI, and the temptation to anticipate the divergence before it confirms ruins most discretionary traders. By the time the divergence is unambiguous, the entry is already moving.
A bot does not have that problem. It waits for the second pivot to print, compares it cleanly against the first, and only fires when the price-momentum mismatch is confirmed by the close. The RSI Divergence Bot applies that logic to MetaTrader 4 and 5, scanning multiple timeframes simultaneously and acting only when divergence aligns with a definable price zone — exactly the kind of mechanical execution this USD/CHF range demands.
For traders who would rather monitor the levels themselves and let an indicator do the heavy lifting, the Support Resistance Indicator automatically marks the 0.7730, 0.7772, 0.7810, 0.7887, 0.7920, and 0.8000 zones across timeframes, so you can see at a glance which level is being defended or rejected without redrawing them every morning.
Key Levels to Watch This Week
The chart hinges on a small handful of prices. To the upside, 0.7887 is the immediate H4 200 MA pivot — sustained acceptance above it is the precondition for any move on 0.7920. The 0.7927/35 band is the line in the sand for the broader reversal thesis; a daily close above it puts 0.8000 firmly in play. Beyond there, 0.8009 (yearly HWC) and 0.8041 (January high) become the next supply checkpoints.
To the downside, 0.7810 is the monthly open and the first true defense line. A clean break below it threatens 0.7769/72, defined by the 61.8% retracement of the yearly range and the 2011 low-week close. Losses through that pivot zone would re-open the downtrend with 0.7730 as the next stop and the 2011 close near 0.7669 as the longer-term magnet. Traders running automation in this pair should make sure their stop logic respects 0.7710 on longs and 0.7960 on shorts — those two prices define where the structure is wrong.
Getting Started with the Setup
If you want to put this framework on autopilot in MetaTrader, here is a practical sequence:
1. Install the RSI Divergence Bot on USD/CHF, H4 timeframe, with default RSI(14) and divergence lookback set to the most recent two pivots.
2. Configure the trade zones so the bot only takes longs between 0.7770 and 0.7820 and shorts between 0.7915 and 0.7945 — this filters out divergences printed in the middle of the range where edge is thinnest.
3. Use the Indicators Tester to backtest the parameters across the last twelve months of USD/CHF data and confirm that the divergence-plus-zone filter actually improves expectancy versus raw divergence.
4. Add the Support Resistance Indicator to the chart for situational awareness — even a fully automated setup is more comfortable to monitor when the key prices are visibly mapped.
5. Start in demo for a full week to confirm the bot is reading divergences the same way your manual review does, then size up gradually as confidence builds.
USD/CHF is at one of those rare moments where the technical map is unusually clean: a defined floor, a stacked ceiling, and a momentum tool that fits the structure. Whether the next move is a breakout through 0.8000 or another rejection back to 0.7730, the trader who has automation in place will be reacting rather than predicting. If you would like help configuring the RSI Divergence Bot or building a custom variant tailored to your risk profile, the team is happy to walk you through it — reach out via the contact page and we will take it from there.