Bitcoin Holds $62,852 in Extreme Fear as the $65,449 EMA Reclaim Looms
Bitcoin is caught in the tension between a fragile short-term recovery and a broken longer-term structure. As of 9 July 2026, BTC/USD trades around $62,852 after carving out a weekly low near $59,800 on 1 July and bouncing almost 10% back toward the $64,000 area. The rebound has real teeth — the 10-day SMA at $62,137 and the 20-day EMA at $62,554 have both flipped supportive — but the heavier moving averages still sit overhead, and sentiment is stretched to the downside.
The Crypto Fear & Greed Index is pinned at 22, deep in Extreme Fear territory. Historically, readings this low mark zones where sellers are exhausted rather than dominant, yet they offer no guarantee of an immediate reversal. The daily RSI at 48.58 tells the same story: indecision, not conviction. For traders, that makes this a levels-driven market where a disciplined, rules-based plan matters far more than a directional guess.
How to Trade the Bitcoin Reclaim Setup
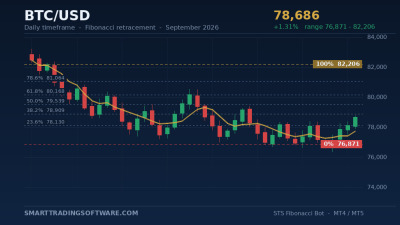
The structure is clean enough to build a plan around. Price is compressing between firm support in the low $60,000s and a stack of resistance running from the daily R1 at $63,452 up to the 50-day EMA at $65,449. That EMA50 is the pivot: reclaiming and closing above it would be the first genuine sign that the bearish daily structure is healing, opening the path toward the July base-case target near $65,600 and, on strength, the psychological $70,000 barrier.
Rather than chasing candles, the higher-probability approach is to trade the edges of the range and let a confirmed reclaim do the heavy lifting. Below are the specific parameters for a long setup built around the EMA50 reclaim.
Entry
Two entries make sense depending on risk appetite. Conservative traders can wait for a decisive 4-hour close above the $63,452 daily R1, entering on the retest that holds. Aggressive traders can scale in on dips into the $61,900–$62,000 demand shelf while the 20-day EMA remains intact, treating the deep-fear reading as a contrarian tailwind.
Stop Loss
Protection belongs just beneath the structural floor. A stop below $59,700 — under the 1 July weekly low — invalidates the recovery thesis. A break there re-exposes the $57,815 level and, potentially, the psychologically loaded $50,000 zone, so there is no reason to stay long once that shelf gives way.
Take Profit
Scale out in tranches into resistance. The first target is the EMA50 at $65,449, where partial profits reduce risk. The second sits at the July bullish objective near $70,000, the top of the broad $65,000–$70,000 supply band. A weekly close above $70,000 would put the $85,000 continuation target in play, but that is a bonus rather than the base case.
Why Automation Beats Emotion in a Fear-Driven Market
Extreme Fear is exactly the environment where discretionary traders make their worst decisions — hesitating on valid entries, then panic-selling supports. Automation removes that emotional drag by executing the plan the same way every time. An algorithm does not feel a Fear & Greed reading of 22; it simply acts on price.
The Crypto Bot is purpose-built for this kind of levels-based crypto setup, managing entries, stops and staged take-profits around defined support and resistance automatically. Because this reclaim hinges on well-mapped horizontal levels, the Support & Resistance Bot is a natural complement, watching the $60,000 floor and the $65,449 ceiling and reacting the instant either flips. And with RSI hovering at a neutral 48.58, momentum traders can layer in the RSI Divergence Bot to flag hidden divergences that often precede a break in either direction.
Key Bitcoin Levels to Watch
Keeping the map simple keeps execution clean. On the downside, the first line of defense is the $61,900–$62,000 demand shelf, reinforced by the 20-day EMA. Below that, $60,000 is the single most important level on the chart — it held during the February 2026 correction, and a sustained loss would risk a slide to $57,815 and then $50,000.
On the upside, immediate resistance is the daily R1 at $63,452, followed by the pivotal 50-day EMA at $65,449. Above there, the $65,600–$65,800 zone separates a real trend recovery from another lower high, with the 200-day SMA still far overhead near $74,225 as a reminder that the larger structure remains a work in progress. Bulls need to reclaim the EMA50 to shift the odds; bears retain control while price prints lower highs beneath it.
Getting Started With the Crypto Bot Setup
Turning this analysis into a live, automated plan takes only a few steps:
- Map the levels on your MetaTrader 4 or 5 chart: support at $62,000 and $60,000, resistance at $63,452 and $65,449.
- Install and configure the Crypto Bot with the entry, stop and take-profit parameters outlined above.
- Add the Support & Resistance Bot to automate reactions at the $60,000 floor and $65,449 ceiling.
- Before going live, stress-test the strategy on historical data with the Indicators Tester to confirm the parameters hold across past volatility regimes.
- Deploy on a demo account first, then scale into a funded account once the setup behaves as expected.
Bitcoin at $62,852 offers a defined, asymmetric setup: tight risk beneath $59,700 against a clear reward toward $65,449 and $70,000. Whether the deep-fear bounce matures into a full reclaim or fades into another lower high, a rules-based bot removes the guesswork and keeps you consistent. Contact our team to match the right automation tools to your risk profile and start trading this setup with discipline.