Ethereum Slides to $1,868 as Oversold Conditions Build
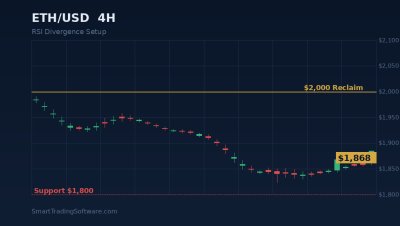
Ethereum opened the first week of June trading on the back foot, with ETH/USD changing hands near $1,868.98 after a 24-hour range that swept from $1,823.85 to $1,985.76. Volume picked up to roughly $26.52 billion across major venues, a clear sign that institutional desks are active around these lows. The monthly performance now stands at -20.38%, and the 200-day EMA has rolled over near $2,509.91, leaving ETH well below its longer-term mean for the first sustained stretch this cycle.
The structural picture is mixed. Daily RSI has slipped beneath the 30 threshold for several sessions, the deepest oversold print since the late-2024 capitulation. At the same time, price is now hugging a multi-month demand zone between $1,800 and $1,900 that has absorbed two prior tests. For traders, that is the textbook setup where bullish RSI divergence has the highest historical success rate — a lower low in price, paired with a higher low in momentum.
Why a Bullish RSI Divergence Is Worth Watching Here
The recent swing low at $1,841 and the current print near $1,868 produced lower lows on the 4H chart, while the 14-period RSI carved out higher lows of 24, 27, and 31 across those same swings. That is a textbook hidden-strength signal. Combined with the $1,800 horizontal support that traces back to the Q1 2025 accumulation base, the technical risk-reward leans toward a mean-reversion bounce, even if the macro trend remains corrective.
The single most important caveat: divergences are early signals, not entry triggers. They need to be paired with a confirmation candle, ideally a 4H close back above the $1,920 micro-resistance, before any long exposure is added. Without that confirmation, oversold can stay oversold — ETH lost $1,800 in 2022 and bled another $400 before basing.
Building the Trade Around the $2,000 Reclaim
The first decisive event for ETH bulls is a daily close back above the round-number $2,000 handle. That level was high-conviction support throughout April; once lost, it flipped into resistance and capped two intraday recovery attempts in late May. A reclaim signals that supply has been absorbed and opens a measured-move target back toward the $2,275 mid-zone and ultimately the $2,300–$2,500 supply pocket where the 200-day SMA at $2,509.91 sits.
Entry parameters
Aggressive entries can stage in on a 4H RSI break back above 35 with price holding above $1,900. More conservative traders should wait for the daily close above $2,000 and a successful retest of that level as new support — typically 12 to 24 hours later. Splitting the position across both triggers lets you average into a stronger structure without committing full size on the first signal.
Stop-loss
The structural invalidation sits below $1,800. A daily close beneath $1,795 takes out the Q1 2025 base and exposes the $1,600–$1,650 air pocket, where the next thick volume profile shelf rests. For 4H traders working off the divergence, a tighter stop beneath $1,825 (just under the recent intraday low) keeps the risk:reward favorable.
Take-profit targets
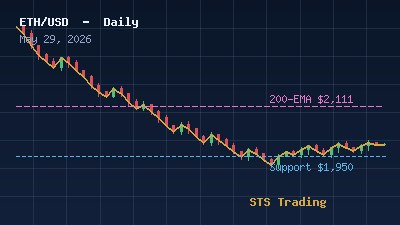
Scale out in three tranches: TP1 at $1,985 (24h high), TP2 at $2,111 (the prior EMA cluster that capped May), and TP3 at $2,275–$2,300 where the broader 2026 mid-range pivots sit. A trail-stop strategy beneath the rising 4H EMA-50 protects the runner if ETH extends toward the 200-day SMA at $2,509.91.
Why Automation Beats Manual Discretion in This Tape
Oversold reversals in ETH typically produce two or three failed bounces before the real recovery prints. Each fakeout drains the conviction of manual traders, who tend to either over-leverage on the third attempt or miss it entirely. An automated bot does not get tired. It does not chase. It waits for its conditions, executes, and manages the risk.
For divergence setups specifically, the RSI Divergence Bot scans the 4H and daily timeframes simultaneously, flagging only setups where price-momentum divergence aligns with a defined support zone. Position size is calculated from a fixed-fractional risk model and stops are placed mechanically against structural lows — which is exactly the discipline most traders abandon when they are watching a chart bleed in real time.
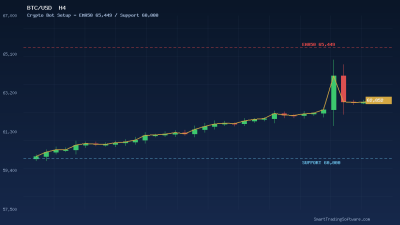
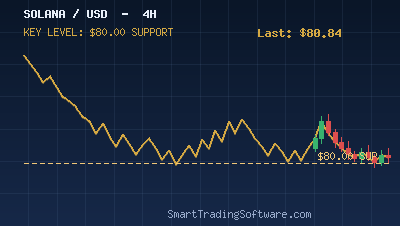
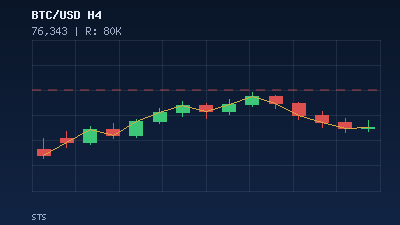
Traders running a broader portfolio across BTC, ETH, and large-cap alts often pair this with the Crypto Bot, which manages multi-symbol exposure under a single risk envelope. The combination — divergence-driven entries plus portfolio-level position sizing — is built for the kind of choppy, range-bound environment ETH is currently caught in.
Key Levels to Watch This Week
Above price: $1,920 (4H pivot), $1,985 (24h high), $2,000 (psychological + flipped support), $2,111 (EMA cluster), $2,275 (mid-2026 range pivot), $2,509.91 (200-day EMA, longer-term resistance).
Below price: $1,841 (recent swing low), $1,823 (24h low), $1,800 (multi-month structural support), $1,650 (next volume shelf), $1,600 (deep correction target).
The market is essentially compressed between $1,800 and $2,000 right now. A breakout in either direction will set the tone for the rest of June. The longer the consolidation drags, the more violent the eventual move tends to be — particularly with the RSI sitting at multi-quarter extremes and futures funding still slightly negative.
Getting Started With the Setup
If you want to deploy this trade systematically rather than babysit the chart, here is a clean four-step process:
1. Install and configure the RSI Divergence Bot on your MetaTrader 4 or 5 terminal, pointed at the ETH/USD symbol on a 4H chart.
2. Validate the parameters on historical data using our Indicators Tester — specifically the divergence sensitivity and confirmation candle filter, which behave differently on crypto than on FX.
3. Set the maximum risk per trade at 1% of account equity, with the structural stop anchored beneath $1,800 for swing entries or $1,825 for tactical 4H trades.
4. Layer the Crypto Bot on top if you want correlated exposure across BTC and large-cap alts capped at a portfolio level rather than per-symbol.
Need help wiring the bots to your broker or tuning the parameters for your account size? Our trading desk handles the setup directly — reach out via the contact page and we will get you live before the next confirmation candle prints.