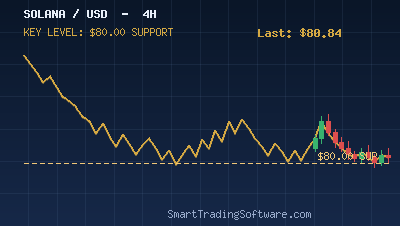
Solana Tests Make-or-Break $80 Support as Bears Press the Floor
Solana (SOL) is trading at $80.84 as of June 2, 2026, sitting right on top of the psychological $80 support line that has defined the asset's range for the past several weeks. The pair is down roughly 2% over the last 24 hours and about 6% on the week, after rejecting from $85.93 last Monday. The structure on the daily chart is clearly bearish: the 50-day moving average sits at $85.30, comfortably below the 200-day moving average at $131.20, confirming the death-cross regime that has dominated price action since early Q2.
The 14-period RSI on the daily chart prints 39.62 — neutral, but drifting toward oversold territory. Volume profile shows a thin pocket of liquidity between $80 and $68, meaning a clean break of the round number could open the door to a swift mark-down toward the yearly low near $68 before any meaningful demand returns. On the upside, sellers are defending the 50-day MA cluster at $85, while $95 is the first level where dip-buyers consistently re-engaged through May.
The bullish counter-case rests on the upcoming Alpenglow consensus upgrade, which is on track for Q3 2026 after passing governance with 98.27% approval last September. The 150ms finality target is the kind of fundamental catalyst that has historically squeezed crowded short positions on Solana — and current funding suggests positioning is once again leaning short.
Trading the $80 Defense: A Mean-Reversion Setup
For traders who want to take the long side at support, the cleanest framework is a confirmed-rejection entry rather than a passive limit order. Letting price tag the level and then close back above it removes most of the risk of catching a falling knife into the $68 liquidity void below.
Entry Criteria
Wait for a 4-hour candle to wick below $80.00 and close back above $80.50. The wick demonstrates that resting bids are absorbing supply; the close confirms buyers are stepping in with conviction. Enter long on the open of the next 4-hour candle, ideally with the RSI ticking up from sub-35 territory.
Stop Loss
Place the stop at $77.20 — below the May 14 swing low and outside the typical noise band on the 4-hour chart. That gives the trade roughly $3.30 of risk per SOL from a $80.50 entry, or about 4.1%.
Take Profit Targets
Scale out in three tranches: 40% at $85.00 (50-day MA confluence), 35% at $89.50 (mid-range pivot), and the remaining 25% at $94.80, just below the structural $95 resistance. The reward-to-risk on the full trade prints near 3.5R, which clears the bar for a counter-trend setup.
Why Automation Beats the Stopwatch on SOL
The problem with trading Solana off the 4-hour chart is that the setup rarely triggers during convenient hours. Confirmation candles routinely close at 02:00 or 06:00 server time, and missing the open of the next bar by even 15 minutes can turn a 3.5R trade into a 1.8R trade. Our Crypto Bot handles exactly this kind of mechanical, level-based execution — it watches user-defined support zones, validates the rejection pattern across multiple timeframes, and fires the entry the instant the candle confirms, with the stop and the laddered take-profits attached from the first millisecond.
For traders who prefer to filter the same setup through a momentum lens, the RSI Divergence Bot is a strong complement. It only engages long when price prints a lower low into support while RSI prints a higher low — the textbook bullish divergence that tends to precede the cleanest bounces from oversold conditions. Combining the two on a single SOL chart gives you mechanical S/R execution plus a quantitative momentum filter, which is roughly the workflow most discretionary desks try to approximate manually.
Key Levels to Watch This Week
The chart simplifies down to a handful of prices that matter:
Immediate support: $80.00 (psychological), then $77.20 (May 14 swing low), with the yearly low at $68.00 as the disaster scenario.
Immediate resistance: $85.00–$85.30 (50-day MA), $89.50 (mid-range), $95.00 (key structural level), and the $128–$132 zone for any larger trend-reversal narrative.
A daily close beneath $77.00 invalidates the long thesis entirely and shifts the bias to short-on-rallies into $85. A daily close above $95 is the first signal that the broader downtrend may be exhausting and that the $128 resistance zone becomes the next magnet.
Getting Started With Automated Solana Setups
If you want to put this framework on autopilot rather than babysitting the chart, the path is straightforward:
1. Backtest the support-rejection logic on SOL/USD 4-hour data using the Indicators Tester. We recommend at least 18 months of history to capture both the 2025 bull leg and the current correction; that range exposes the strategy to enough regimes to produce a credible expectancy curve.
2. Tune the support level array on the Crypto Bot to the $80, $77, $68 ladder discussed above, set the wick-and-close confirmation window to 4 hours, and dial in the laddered take-profits at $85 / $89.50 / $94.80.
3. Layer the RSI Divergence Bot as a confluence filter on the same instrument, so only setups that satisfy both the structural and the momentum conditions get capital.
4. Forward-test on a demo account for at least two weeks before promoting the configuration to live capital. SOL's volatility profile changes fast around upgrade catalysts, and the Alpenglow timeline in Q3 means the next few months will not look like the last few.
If you want help wiring any of this into your MetaTrader setup or sizing the strategy to your account, our team is one click away on the contact page. We are happy to walk through the parameters with you and share the exact configuration files our analysts use on their own SOL accounts.