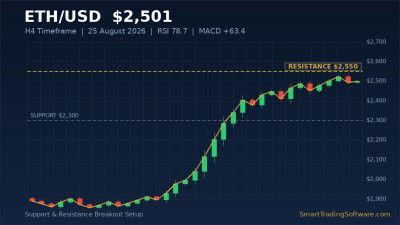
Ethereum Stalls Near $1,989 After Pullback from Mid-May Highs
Ethereum (ETH) is trading near $1,989 on May 29, 2026, after slipping from the May 15 swing high at $2,371. The recent retracement has put the 200-day EMA around $2,111 back in play as overhead resistance, while bulls fight to hold the $1,950 horizontal floor. Daily volume sits at roughly $8 billion, market cap around $248 billion, and the 14-day RSI is hovering at 46.9 — a clean neutral reading that gives momentum traders very little signal in either direction.
The MACD histogram on the daily chart has rolled negative after several failed pushes through $2,160, confirming the loss of short-term momentum. Despite the soft tape, on-chain flows tell a quieter bullish story: whale wallets accumulated more than 140,000 ETH (roughly $322 million) over the last four days, and pre-Glamsterdam upgrade positioning is starting to show in long-dated futures open interest. For now, however, price is locked in a tight $1,950–$2,060 range, and the only setup that respects the data is a clean reaction trade at well-defined support and resistance.
Why a Support & Resistance Strategy Works in This Tape
Ranging markets eat trend-followers alive. When ETH is grinding between the 200-day EMA above and a thick demand cluster below, breakout entries get faded and pullback entries get stopped by sudden wicks into liquidity. The traders who consistently extract money from this kind of structure do one thing: they pre-mark high-quality horizontal levels and let price come to them, then trade rejections with mechanical risk.
That is precisely what a rules-based bot is built to do. The Support & Resistance Bot for MetaTrader 4 and 5 maps swing pivots from multi-timeframe data, ranks them by reactions and time-decayed weight, and only enters when price taps a Level A or Level B zone with a confirming reversal pattern. No discretionary FOMO, no chasing — just disciplined execution at zones that statistically matter.
Trade Setup: ETH Long at $1,950 Demand
The cleanest setup right now is a long from the $1,940–$1,960 demand block — the same zone that absorbed sellers twice in mid-May and aligns with the rising 50-week MA. Below are the parameters to plug into the bot or manage by hand:
Entry: $1,948–$1,960 on confirmed bullish engulfing or pin bar (4H or H1 close).
Stop Loss: $1,892 — below the May 27 wick and the $1,900 psychological floor.
Take Profit 1: $2,050 (prior resistance, ~1.8R).
Take Profit 2: $2,111 (200-day EMA).
Take Profit 3: $2,160 (range top).
Position size: max 1% account risk per leg.
Trade Setup: Short on Failure at $2,111
If price rallies straight into the 200-day EMA without first tagging $1,950, the reaction short becomes the better risk/reward play. Wait for a clear rejection candle on the H4 between $2,108 and $2,118, then short with stops above $2,165 (the May 18 swing high). Target $2,050 first, then $1,990. The same Support & Resistance Bot can take both sides of this range automatically when the levels are loaded as a single basket.
Where Automation Beats the Discretionary Trader
Crypto runs 24/7, and ETH almost never gives you a clean entry during your local trading hours. The $1,950 demand zone has already been tagged twice in 2026, both times during low-volume Asian session candles that most retail traders slept through. A bot doesn't sleep, doesn't second-guess, and doesn't widen its stop after a wick. It simply executes the plan you back-tested.
Pairing two tools sharpens the edge further. The RSI Divergence Bot watches for hidden bullish divergence on the H4 inside the demand zone — a high-probability confluence signal that filters out the false taps. Before going live with either bot, it is worth running 12–18 months of historical ETH data through the Indicators Tester to confirm the level-reaction edge holds across both the 2024 bull leg and the 2025 chop. Most traders skip this step and then blame the strategy when their first month is a drawdown month.
Key ETH Levels to Watch This Week
Below are the structural levels that matter for trade management in the days ahead. They are ranked by historical reaction strength and timeframe weight.
Major Resistance:
• $2,371 — May 15 swing high, last lower-high before reclaim attempt.
• $2,160 — top of current consolidation range.
• $2,111 — 200-day EMA, the line that defines macro trend.
• $2,050 — prior pivot, first overhead supply.
Major Support:
• $1,950 — three-touch horizontal demand.
• $1,892 — May 27 capitulation wick low.
• $1,800 — Q1 2026 accumulation base; loss opens $1,600.
• $1,600 — last-defense level for the macro bullish structure.
A daily close above $2,160 flips the short-term bias bullish and exposes $2,371 again. A daily close below $1,892 is the bear trigger that puts $1,600 on the table.
Getting Started With the Setup
Here is a practical, four-step rollout if you want to put this trade plan on automation rather than babysit charts:
1. Run a 12-month backtest on ETH/USD H4 data with the Indicators Tester to validate the level-reaction model on your broker's feed.
2. Install the Support & Resistance Bot on MT4 or MT5 and load the level basket above ($1,950 / $2,050 / $2,111 / $2,160).
3. Layer the RSI Divergence Bot as a secondary filter on the same chart to only fire long entries on divergence confirmation.
4. Cap risk at 1% per leg, walk forward for two weeks on a demo, then graduate to live with a small lot.
Ethereum's next directional move is not far away — Glamsterdam is targeting June 2026, and historically major upgrades produce sharp pre-event repricings. Whether the path higher starts from $1,950 or from a deeper sweep into $1,800, the bot-driven approach removes the emotional layer and lets the math do the work.
Want help configuring the Support & Resistance Bot for your broker, risk profile, or specific ETH timeframe? Reach out to our team and we'll walk you through the setup end-to-end.