DAX 40 Holds 26,440 After First-Ever Push Above 26,500
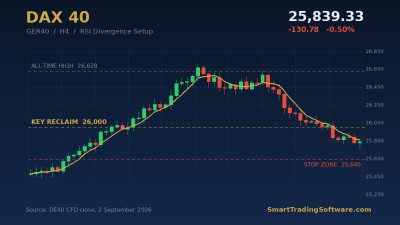
The DAX 40 finished Friday, 14 August 2026 at 26,440 points, up 141 points or 0.53% on the day, and it did so within touching distance of the record high the index set earlier this month when it traded above 26,500 for the first time in its history. That record came on renewed hopes of a negotiated end to the Iran conflict, which stripped some of the energy risk premium out of European equities after roughly four weeks of sideways consolidation.
What matters for traders is the structure underneath the headline. Price is still printing higher highs and higher lows on the four-hour chart, and the flat resistance band that capped the index through July now sits beneath the market as support. At the same time the DAX is grinding into the 26,350–26,450 area, where buying momentum has visibly slowed. The 10 August session is the tell: the index rallied hard, ran into 26,400, and gave back about half the move before the close. Zoom out and the primary trend is not in question — the monthly 50-period moving average sits near 20,500 and has not been broken since November 2022.
The ambiguity lives in the aggregate indicators. Moving-average readings across timeframes currently come out at nine buy signals against three sell signals, yet the combined daily technical rating still reads neutral. That is exactly what you would expect from an index that has run into a ceiling without actually rejecting it. It is a breakout-pending tape, not a reversal tape, and the two require very different execution.
Why a Moving-Average Breakout Approach Fits the Current DAX
When an index is riding the upper edge of an ascending channel at all-time highs, there is no overhead supply to lean on. Every technique that works inside a range — fading the highs, selling into round numbers — becomes a low-probability trade, because there are no trapped longs above the market waiting to sell into strength. What is left is the trend itself, and the most reliable mechanical proxy for that trend is the relationship between price and its moving averages.
That is why an MA-breakout framework travels better here than a discretionary top-picking one. Instead of guessing where the ceiling is, you define the moving average that has contained the pullbacks, wait for price to resolve away from it with confirmation, and trade in that direction with the invalidation already set. The STS MA Breakout Bot is built for exactly this: it automates strategies based on the breakout of pre-selected moving averages on MetaTrader 4, so the trigger is sitting in the market before the headline arrives rather than after. On an index that can gap on a single Middle East wire story, that difference is most of the edge.
Entry Trigger
The cleanest long trigger is a four-hour close above 26,500 — not merely an intraday spike through it. The 26,400 handle has already rejected price once, so a wick above the level is noise; a body close above the prior record high is structure. A conservative variant is to wait for the retest: after the breakout close, allow price to pull back into 26,420–26,470 and enter on the hold. The bearish alternative is a four-hour close back below 26,000, which would confirm failure at the channel top and open the downside scenario.
Stop Loss Placement
For the breakout long, place the stop below the last four-hour higher low, roughly 26,180, giving about 320 points of room from a 26,500 entry. On the retest entry the stop can tighten to just under 26,300, around 150 points. Given typical DAX daily ranges in the 250–400 point band this year, anything tighter than 120 points is inside the noise and will be taken out by a routine European open.
Take Profit Targets
The first objective is the measured move from the July consolidation: the roughly 500-point range projected off the 26,500 breakout gives an initial target near 27,000, a level that also sits as the next psychological round number. Scale a portion there and trail the balance along the rising channel. For the short scenario below 26,000, the first target is the 25,100–25,300 shelf that acted as resistance in late May, with the deeper 24,500 level marking the top of the broader 23,000–24,500 support zone that would need to hold to keep the annual uptrend intact.
Where Automation Actually Earns Its Keep
A breakout at all-time highs is a timing problem more than an analysis problem. The level is obvious — everyone can see 26,500 — so the edge comes from executing the moment it confirms rather than fifteen minutes later, and from not taking the trade at all when the close does not confirm. Both are things discretionary traders reliably get wrong, in opposite directions: they jump early on the wick, then hesitate on the real close.
Two supporting tools are worth pairing with the setup. The STS MA Distance Indicator quantifies how far price has stretched from its moving average, which is the single most useful sanity check on an index making new highs. A breakout taken while price is already far extended from the mean carries materially worse expectancy than the same signal taken from a compressed base — and extension is precisely the condition that develops near a channel top. Using distance-to-MA as a filter rather than a signal is the point.
If you would rather define the channel from confirmed swing highs and lows than from a moving average, the STS Zig Zag Bot automates strategies built on the Zig Zag indicator, which maps that pivot structure for you. It is a reasonable alternative framing for the same trade, and some traders find pivot-based levels cleaner than MA-based ones on index CFDs.
Before committing capital to any of it, run the parameters through the STS MA Distance Tester, which back-tests strategies based on distance to a moving average across historical data. This step matters more than usual right now: the 2026 tape has been unusually trend-persistent, so a breakout system tested only on this year's data will look far better than it will perform in a normal year. Testing across 2022–2024, when the index spent long stretches ranging, gives a much more honest read on drawdown.
Key DAX Levels to Watch
Resistance: 26,400 (immediate barrier, already rejected once), 26,500 (record high and breakout trigger), 27,000 (measured-move target and psychological round number).
Support: 26,180 (last four-hour higher low), 26,000 (major psychological level and the bull/bear line for this setup), 25,100–25,300 (late-May resistance shelf, now first real demand), 24,500 (top of the broader support zone), 23,000 (the level the index needs to hold to keep the medium-term uptrend intact).
Two macro variables sit on top of this chart. The first is European energy: German industry is the engine of the index, and any renewed disruption around the Persian Gulf hits the DAX harder than it hits its European peers. The second is the ECB. Policy is expected to stay on hold through 2026, but Isabel Schnabel has flagged the risk that hikes could arrive earlier than the market is positioned for — a repricing that would land squarely on the rate-sensitive industrials carrying this rally. On the supportive side, the German government's planned infrastructure programme is a genuine multi-year tailwind for exactly those names.
Getting Started
- Load a DAX 40 (GER40) chart on MetaTrader 4 and mark the ascending channel from the July lows, plus horizontal lines at 26,000, 26,400 and 26,500.
- Install the STS MA Breakout Bot and configure it for four-hour close confirmation rather than tick-through entries.
- Add the STS MA Distance Indicator as a filter and set a threshold that suppresses entries when price is already stretched from the mean.
- Back-test the combination with the STS MA Distance Tester across at least three years of DAX history, including the ranging periods, and size positions off the resulting drawdown rather than the headline return.
- Run the configuration on a demo account through at least one full ECB meeting cycle before going live.
The DAX is doing the hardest thing a market can do to a trader: making new highs while looking expensive. That is a setup that punishes both reflexive fading and undisciplined chasing, and it is why a rules-based approach with a pre-defined invalidation is worth more here than another opinion about where the top is. If you want help matching a configuration to your account size and risk tolerance, get in touch with our team and we will walk through the parameters with you.
Risk warning: this article is market commentary and educational material, not investment advice. Index CFDs and leveraged products carry a high risk of losing money rapidly. Price levels cited reflect data available as of 17 August 2026 and will move. Never trade with capital you cannot afford to lose, and test any automated system on a demo account first.