Gold Steadies Near $4,372 as a Bullish RSI Divergence Builds
Gold spent the middle of September working off the damage from a sharp slide earlier in the month. Spot XAU/USD was quoted around $4,372 on Thursday, 17 September 2026, after finding a floor in the $4,258-$4,260 area and clawing back roughly a hundred dollars over the following sessions. It is not a dramatic recovery by gold’s 2026 standards, but the shape of it is worth a second look.
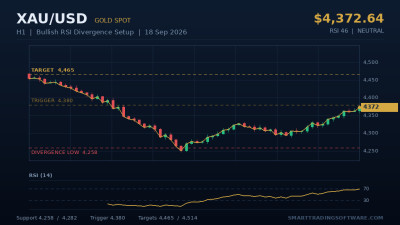
The RSI is sitting near 46 — squarely neutral, and a long way from the stretched readings that capped the August rally. What makes the current reading interesting is not the level but the divergence underneath it. On the hourly chart, price printed a lower low into $4,258 while the RSI printed a higher low: the classic bullish divergence pattern that often precedes a move back toward the previous swing high.
Above the market, the first real test is the $4,378-$4,380 band, followed by $4,394-$4,397. Beyond that, the levels that matter are $4,465 and then $4,514. That last figure is the one most desks are watching. While gold trades below $4,514, the risk of another leg down toward $4,378 and $4,281 stays alive. Clear it, and the path opens toward $4,855 and eventually the $5,597 all-time high.
The Setup: Trading Gold’s RSI Divergence Toward $4,465
A divergence on its own is not a trade. It is a warning that momentum and price have stopped agreeing with each other, and that warning is only useful once price confirms it. The setup below takes the divergence off the $4,258 low as context, then waits for structure to validate it before committing any capital.
Entry
Wait for an hourly close above $4,380, the top of the first resistance band. Entering inside the $4,318-$4,355 congestion zone means buying into supply, and gold has already rejected that area once this week. A confirmed close above $4,380 puts the divergence to work rather than anticipating it. A conservative alternative is to wait for the retest: many traders prefer to buy the pullback into $4,378 after the break, which keeps the risk tighter.
Stop Loss
Place the stop below $4,282, the intermediate support that held on the way down. From an entry near $4,380 that is roughly 98 dollars of risk. Traders wanting less exposure can tuck the stop under $4,318 instead, though that sits close enough to the recent congestion to get clipped on a perfectly normal retracement.
Take Profit
The first target is $4,465, the next clean resistance shelf. Scaling out half there and trailing the remainder is the more practical approach, because the real prize is $4,514. A daily close above that level changes the medium-term picture entirely, and a runner left open into that break is worth considerably more than a flat exit at the first target.
Why Automation Helps on This Particular Trade
Divergence setups are unusually demanding to trade by hand. The signal forms over hours, the confirmation arrives on a candle close that might land at three in the morning, and the invalidation is a single price print. Missing the close by ten minutes usually means missing the trade — or worse, chasing it fifty dollars higher with a stop that no longer makes any sense.
The STS RSI Bot was built for exactly this problem. It scans for regular and hidden divergences between price and RSI across the timeframes you enable, waits for the confirming close rather than firing on the divergence itself, and applies the stop and target rules you defined before the trade opens. To read the divergence in context, the STS RSI MTF Indicator ships with parameter sets already tuned to XAU/USD volatility, which matters more than most people expect. Gold’s average range routinely makes settings borrowed from major currency pairs behave badly.
Before either goes anywhere near a live account, test it. The STS RSI Tester lets you replay the RSI logic across gold’s history and see how the divergence rule would have performed through 2025 and 2026, including the choppy stretches where it would have lost money. That second part is the useful part.
Key Levels to Watch
- $4,514 — the line separating the neutral-to-bearish base case from a genuine bullish reversal
- $4,465 — first major resistance and the primary target for this setup
- $4,394-$4,397 — minor supply; expect a pause here
- $4,378-$4,380 — the confirmation trigger. The whole setup hinges on this band
- $4,318-$4,355 — congestion zone, currently overhead
- $4,282 — intermediate support and the logical stop location
- $4,258-$4,260 — the divergence low. A close below this invalidates the idea outright
For reference, the September consensus range runs from $4,136 to $5,304, with month-end estimates clustered around $4,444 on the conservative side and $5,051 on the optimistic one. That is an enormous spread, and a fair reflection of how much of gold’s direction from here depends on the next US inflation print and what it does to rate expectations.
Getting Started
- Open XAU/USD on the H1 and H4 charts in MT4 or MT5 and mark the levels listed above.
- Add RSI with a 14-period setting and check the divergence against the $4,258 low for yourself.
- Install the STS RSI Bot, then set confirmation at $4,380, stop at $4,282 and first target at $4,465.
- Backtest the configuration with the STS RSI Tester over at least twelve months of gold data.
- Run it on a demo account for a full week before risking real capital.
- Size the position so the $98 stop represents no more than one to two percent of the account.
Gold at $4,372 is neither cheap nor obviously expensive. It is a market waiting for a catalyst, with a momentum signal quietly suggesting which way it might break. If you would like help configuring any of these tools for your account size or risk tolerance, get in touch with our team and we will walk you through the settings.