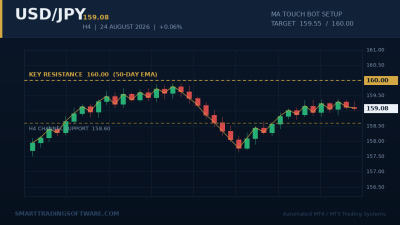
USD/JPY Holds 159.08 With 160.00 Still Out of Reach
USD/JPY finished Monday, 24 August 2026 at 159.08, up 0.06% on the session and barely changed from where it opened the week. That flat close hides a fairly eventful few days. The pair ground sideways through most of last week, then dropped hard on 20 August when the US Treasury confirmed it would sharply increase issuance at the long end of the curve. Yields fell roughly nine basis points on the headline and the dollar went with them — but dip buyers showed up almost immediately and pushed price back above the 200-day EMA before the New York close.
That recovery is the single most important technical fact on the daily chart right now. The 200-day EMA has held as support on every test since the spring, and each failed break has produced a bounce rather than a trend change. Above the market, the 50-day EMA sits just north of 160.00, which turns that round number into a genuine barrier rather than a psychological one. Price has approached it several times this month and has not managed a daily close above it.
On the four-hour chart the structure is tighter still: a sideways channel with resistance near 159.55 and support near 158.60. Zoom out to the daily and the range widens considerably, with resistance up at 163.95 and the last real shelf of support down at 155.20. Between those extremes the pair is rotating, not trending.
The macro backdrop explains the indecision. The Bank of Japan is at 1.00% after June's 25 basis point hike — the highest policy rate since 1995 — and held there in July on an 8–1 vote, with Hajime Takata dissenting in favour of 1.25%. Japanese inflation has now accelerated for a second consecutive month, which keeps another hike firmly on the table. Meanwhile the Fed sits at 3.50–3.75% and is expected to keep easing. The carry differential that drove USD/JPY higher for years is narrowing, but it has not closed, and 250 basis points is still 250 basis points. That tension is exactly why the pair keeps buying dips without ever running away to the upside.
Why a Moving-Average Touch Strategy Fits This Tape
When a market trends cleanly, breakout systems work. When it chops, mean-reversion oscillators work. USD/JPY at the moment is doing something in between: it holds a shallow upward bias defined by its moving averages, but every push into resistance gets sold. Pure breakout entries above 159.55 have been repeatedly stopped out, and fading strength blindly is dangerous while the carry trade still favours the dollar.
The setup that has actually paid in this environment is the pullback. Price drifts away from its moving average, buyers step in when it returns to touch that average, and the move resumes toward the top of the range. It is an old idea, and it works here because the moving averages are the levels institutional flow is actually watching — the 20-period EMA on H4 for the short-term rotation, the 200-day EMA on the daily for the structural floor.
The hard part is execution. A moving-average touch lasts minutes, sometimes seconds, and it usually happens during the London–Tokyo handover or immediately after a US data print. Watching a chart for that moment across three sessions is not realistic for most traders, which is precisely the gap automation fills.
Our STS MA Touch Bot for MetaTrader monitors the distance between price and a configurable moving average and opens a position when price returns to touch it, in the direction of the prevailing trend. It handles the entry, the stop and the exit without supervision, which matters on a pair like USD/JPY where the decisive moves regularly happen while European traders are asleep.
Entry Parameters
For the current USD/JPY structure, a reasonable configuration is a 20-period EMA on the H4 chart as the touch line, with the 200-period EMA on the daily used as a directional filter. Longs are only permitted while daily price sits above that 200-day line — which, as of the 24 August close, it does. The bot waits for price to trade back into the H4 EMA and enters on the touch rather than trying to predict it. Realistically that puts entries in the 158.60–158.90 zone on the next pullback.
Stop Loss
Place the stop below the H4 channel floor, not immediately under the entry. With support at 158.60 and the wider swing structure holding around 157.65, a stop near 157.50 gives the trade room to survive a normal shakeout while still capping the loss at roughly 130–140 pips. Traders using a tighter risk budget can anchor to 158.20 instead, accepting a higher chance of being stopped on noise. Anything above 156.00 keeps the longer-term bullish structure intact; below it, the thesis is simply wrong and the position should be closed.
Take Profit
The first target is the H4 channel ceiling at 159.55, which is where the last several rallies have stalled. A partial exit there and a stop moved to breakeven is the conservative route. The second target is 160.00, and a confirmed close above 160.65 opens the path toward 160.85 and, in the more aggressive scenario, the daily resistance at 163.95. Running from 158.75 to 160.00 gives a reward-to-risk ratio near 1:1 on the tight stop and closer to 1:0.9 on the wide one — which is why partial scaling at 159.55 matters rather than holding for the full move.
Risk Sizing
USD/JPY carries intervention risk that most majors do not. Japanese officials have intervened before, and a surprise move can produce a 200-pip candle in minutes. Cap risk at 1% of account equity per position, avoid holding size into BOJ meeting days, and be aware that the pair's overnight swap works in favour of longs while the rate gap persists.
Key Levels to Watch
Resistance sits at 159.55 (H4 channel ceiling), 160.00 (round number and 50-day EMA), 160.65 (breakout confirmation), 160.85 and 163.95 (daily resistance). Support sits at 158.60 (H4 channel floor), 157.65, 156.65, 156.00 (structural invalidation) and 155.20 (daily support).
The one-month consensus range currently spans roughly 157.03 to 162.19, with an average forecast near 159.60 — almost exactly where the pair is trading. Year-end 2026 estimates run anywhere from 150 to 164, a fourteen-point spread that tells you how little agreement there is about whether the yen finally strengthens or the dollar stays dominant. In a market that undecided, a rules-based system that trades the range beats a discretionary opinion about the destination.
Two tools make the setup easier to monitor. The STS MA Distance Indicator plots how far price has stretched from its moving average in pips or ATR multiples, so you can see a touch developing before it happens. The STS MA Distance Tester lets you backtest which moving-average period and distance threshold would have performed best on USD/JPY historically, instead of guessing at settings.
Getting Started
- Load USD/JPY on the H4 chart in MetaTrader 4 or 5 and add a 20-period EMA, plus the 200-period EMA on the daily timeframe as your trend filter.
- Install the STS MA Touch Bot and set the touch line to the 20 EMA, direction to long-only while daily price holds above the 200-day EMA.
- Set the stop at 157.50 and configure a partial take profit at 159.55 with the remainder targeting 160.00.
- Run the MA Distance Tester across at least twelve months of USD/JPY history to validate the parameters before committing capital.
- Forward-test on a demo account for two to four weeks, paying particular attention to how the bot behaves around BOJ announcements and US data releases.
- Go live with 1% risk per trade and review the settings if the pair closes below 156.00.
USD/JPY is not going to make anything easy while the Fed and the BOJ are moving in opposite directions at different speeds. What it is offering is a well-defined range with clear moving-average reference points, and that is a tradeable condition provided the execution is disciplined. If you want help configuring the MA Touch Bot for your broker's USD/JPY spread and swap conditions, get in touch with our team — we will walk through the parameters with you.