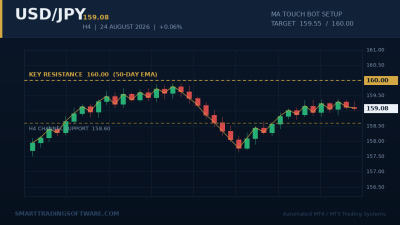
Cable Slips to 1.3507 as the 1.3520 Floor Gives Way
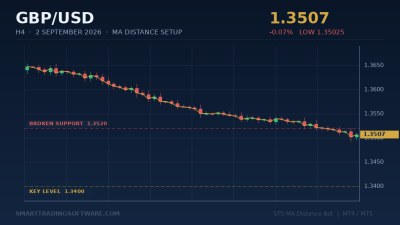
GBP/USD began September on the back foot. The pair was trading at 1.3507 on Wednesday, 2 September 2026, against a previous close of 1.3516, after printing a session low of 1.35025 — the weakest cable has been since 19 August. That completes a week-long unwind from 1.36405, the high posted on 26 August, and it leaves price on the wrong side of a level that had been holding for a fortnight.
Most of the move belongs to the dollar rather than to the pound. Hawkish commentary from Federal Reserve officials ahead of the 15–16 September FOMC meeting has taken the certainty out of the easing trade. Swap markets still price roughly 50 to 75 basis points of cuts through year-end, but with visibly less conviction than a fortnight ago. Add a firmer oil market and the risk aversion that came with it, and a high-beta, current-account-deficit currency like sterling ends up carrying the cost.
The UK leg of the story is quieter. Cheaper crude through the summer took enough heat out of the inflation path that markets have pushed the next Bank of England move into 2027 from late 2026, and the 17 September BoE meeting is now more about the vote on balance sheet reduction than about Bank Rate itself. Before either central bank speaks there is US payrolls, US CPI, UK GDP and UK CPI to get through. Consensus has the pair near 1.3327 by the end of the month, while end-2026 estimates are scattered anywhere between 1.3339 and 1.4750, with most bank desks clustered at 1.36–1.40. Nobody agrees, in other words, and the range is doing the deciding.
Why Distance From the Mean Is the Cleaner Read Here
The daily chart is not trending. It is a range, and a reasonably well-defined one. The upper boundary of the pattern that has contained price since July sits between 1.3560 and 1.3620 — precisely where the 26 August rally was rejected. Above that there is a second shelf at 1.3650–1.3675, and then the long-term ascending resistance drawn from the 2023 lows, currently near 1.3820. On the downside 1.3520 has just gone. The next real floor is 1.3400, and beneath that the chart opens toward 1.3273.
Trend-following systems get chopped to pieces in this kind of tape. What tends to work better is measuring how far price has stretched from its own moving average and trading the extremes, because inside a range the distance from the mean is the signal and the direction is mostly noise. That is the premise behind the STS MA Distance Bot: it tracks the gap between price and a configurable moving average and only acts when that gap crosses a threshold you set, rather than every time a candle closes on the wrong side of a line.
Entry
Two setups are live. The continuation entry triggers on a four-hour close below 1.3500 with price extended beneath the 50-period MA by more than one average true range. That combination argues the 1.3520 break was genuine supply rather than a stop run, and it aims at 1.3400. The mean-reversion entry is the mirror image: if price stretches below the MA by roughly 1.5 ATR without setting a fresh daily low, the bot buys the snap back toward the average and targets the 1.3560 range edge.
Stop Loss
For the short, 1.3565 is the logical stop — above the lower edge of the pattern and above the 26 August rejection wick, so a genuine re-entry into the range invalidates the trade instead of merely bruising it. For the long, 1.3455 sits under the recent basing area. On a pair that can travel 100 pips in the twenty minutes after a US CPI print, a fixed-pip stop is a liability. Scale it to volatility with the STS ATR Level Indicator, which plots ATR-derived levels directly on the chart so the stop widens when the tape gets loud and tightens when it settles down.
Take Profit
First target on the short is 1.3440, roughly the midpoint of the decline from 1.36405. Second target is 1.3400. A daily close beneath it opens 1.3273, though that is a September-into-October objective rather than a same-week one. On the long side, 1.3560 first and 1.3620 second. Risk-reward on the short leg from 1.3500 with a 1.3565 stop and a 1.3400 target works out near 1:1.5 — acceptable rather than spectacular, which is roughly what range trading pays.
Position Size and Session Filter
Cable's liquidity is concentrated in the London session and the London–New York overlap. Outside those hours spreads widen and false breaks multiply, so restrict the bot's trading window to 08:00–17:00 London time and keep risk at 0.5–1% of account equity per position given how much event risk sits between now and the 17th.
Why You Want This Automated
The hard part of this strategy is not the rules. It is following them at 13:30 London on a payrolls Friday, when price has already covered 60 pips before your platform has finished repainting and the urge to chase is at its strongest. An expert advisor does not chase. It measures the distance, checks the threshold, and either fires or does not.
Automation also handles the second problem, which is that MA distance thresholds are pair-specific and regime-specific. What counts as stretched on cable during a quiet August is not what counts as stretched in the week of a Fed meeting. Rather than guess, put the parameters through history first. The STS MA Distance Tester replays your threshold, MA period and ATR multiplier across previous GBP/USD ranges, so you can see how a 1.5 ATR trigger actually behaved through the April and June volatility instead of assuming it would have worked. Both tools run on MT4 and MT5.
Key Levels to Watch
Resistance: 1.3560 (range edge, first upside target) · 1.3620 (upper boundary of the July–August pattern) · 1.3675 (August shelf) · 1.3820 (ascending resistance from the 2023 lows).
Support: 1.3500 (round number, current battleground) · 1.3440 (measured midpoint) · 1.3400 (major floor) · 1.3273 (2026 swing low).
The one level that decides the next fortnight is 1.3400. Hold it and the range survives into the Fed and BoE meetings, which keeps both halves of this plan in play. Lose it on a daily close and the pattern resolves lower, at which point the mean-reversion side should be switched off and only the continuation logic left running.
Getting Started
- Open GBP/USD on the four-hour chart and mark 1.3400, 1.3500, 1.3560 and 1.3620.
- Install the STS MA Distance Bot and set the MA period to 50, the continuation threshold to 1.0 ATR and the reversion threshold to 1.5 ATR.
- Add the STS ATR Level Indicator so stops and targets are sized to current volatility rather than to a habit.
- Backtest the configuration with the STS MA Distance Tester across at least six months of GBP/USD history, including the April and June swings.
- Forward test on a demo account through the 15–17 September central bank window before committing real capital.
Ranges do not last forever, and this one has a Fed meeting and a Bank of England vote pointed at it. If you would like help matching the MA period, ATR multiplier and session filter to your account size and broker spreads, get in touch with the STS team and we will walk through the settings with you.