Aussie Holds 0.7143 as the Channel Top at 0.7207 Comes Back Into View
AUD/USD spent the first days of September grinding through a range that has become familiar. The pair was quoted around 0.7143 on Wednesday, 2 September 2026, after a session that reached 0.7180 early on and slipped back to 0.7140 once the US data hit the wires. A stronger-than-expected US GDP print pushed the dollar higher into the close, which took the shine off what had been a fairly clean run higher for the Aussie.
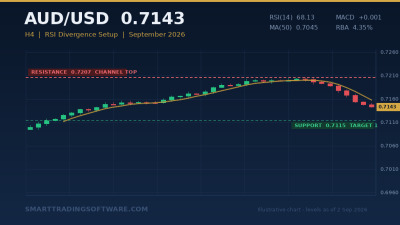
The bigger structure is still constructive. Price has been climbing inside an ascending channel since it turned at 0.6920, setting higher local highs along the way, and the upper boundary of that channel now sits near 0.7207. The pair tapped that boundary, failed, and has been working off the excess ever since. On the daily chart the 50-day moving average is down at 0.7045 and MACD is marginally positive at 0.001 — a trend that is intact but no longer accelerating.
The interesting part is the momentum reading. The 14-day RSI is at 68.13. That is strong, and it is not technically overbought, but it is close enough to the 70 line that any further push toward 0.7207 without a matching RSI high starts to look like classic bearish divergence. That is precisely the condition worth automating, because it is easy to describe and very easy to miss when you are watching the chart in real time.
Fundamentally, the Aussie has a reason to be firm. The RBA is holding at 4.35%, and after the hot July inflation read Goldman Sachs moved to a November hike call at 4.60% while flagging genuine risk of an earlier move in September. Against a Fed that is still expected to ease, the yield differential argues for the Aussie. But the market has already priced a lot of that, which is why the 0.7207 ceiling keeps rejecting.
Trading the RSI Divergence Fade at the Channel Boundary
The setup here is not a trend reversal call. It is a fade of the final push into a known resistance level, with the trend structure below still providing a floor. That distinction matters, because it dictates how tight the stop should be and how modest the targets need to be.
The logic is straightforward. If AUD/USD makes a new swing high above the 0.7180–0.7207 band while the 14-day RSI prints a lower high than its reading at the previous swing, momentum is not confirming price. That is bearish regular divergence. The trade is short from the failed push, targeting the mid-channel area rather than a full trend break.
Entry Conditions
Wait for price to trade above 0.7175 and form a swing high. Compare the RSI value at that high with the RSI value at the previous swing high. If the new price high is accompanied by a lower RSI high, and RSI then crosses back below 70, that is the trigger. Enter short on the close of the candle that confirms the RSI cross, or on a retest of the broken swing low if you prefer confirmation over immediacy.
On the H4 chart, one important filter is not to take the signal if the candle closes above 0.7210. A clean close through the channel boundary invalidates the fade — at that point the market is telling you the divergence has been absorbed, and the alternative scenario of 0.7175–0.7207 becoming support takes over.
Stop Loss Placement
Place the stop 25–30 pips above the swing high that generated the signal. If the high prints at 0.7195, the stop belongs around 0.7222 — above the channel boundary, above the round number, and above the noise band where stop hunts tend to cluster. On a 0.7143 reference price that is a risk of roughly 55 to 80 pips depending on where the signal fires, which is a reasonable size for a pair with AUD/USD current ATR.
Take Profit Targets
Take the first target at 0.7115, the nearest downside level and the first place the pair reacted on the way up. Bank a partial there and move the stop to break-even. The second target is 0.7088; below that, the correction opens up toward 0.7023, which is where the ascending channel lower boundary and the 50-day moving average start to converge. That third target is worth holding a small runner for, but it should not be the base case.
Run this at 1–2% risk per position. The setup does not fire often, and it does not need to — the value of a divergence fade is that it catches the exhaustion move, not that it trades every day.
Why This Setup Is Better Automated Than Watched
Divergence is one of those patterns that is obvious in hindsight and genuinely difficult to catch live. You need to be tracking two swing highs on price, two matching RSI readings, and the 70-line cross, all at the same time, and the signal typically appears during the Asian or London session when most traders are not in front of the platform.
The STS RSI Bot handles this mechanically. It scans for regular and hidden divergence between price and RSI, applies your swing-detection sensitivity, and executes with your stop and target parameters attached from the moment the position opens. No missed signal because the setup formed at 3am, and no talking yourself out of a valid short because price looks strong.
For traders who want a wider view before committing, the STS RSI MTF Indicator is a useful companion. It plots RSI from several timeframes on a single chart, so you can check that an H4 divergence signal is not fighting a daily RSI still driving hard in the opposite direction. On a pair like AUD/USD, where the daily trend is up and the H4 is correcting, that filter is what separates a clean fade from fighting the trend.
Before you commit capital to any of it, backtest the parameters. The STS RSI Tester lets you replay the RSI settings against AUD/USD history and see how the divergence rules would have behaved through the 0.6920 rally — including the periods where they did not work, which is the more useful half of the exercise.
Key Levels to Watch
On the upside, 0.7148 is the immediate resistance and the level that has been capping short-term buying. Above it, 0.7175 and then the channel boundary at 0.7207 are the reference points. A daily close above 0.7210 changes the picture and puts 0.7300 on the table.
On the downside, 0.7115 is the first support and the first divergence target. A break below 0.7088 deepens the correction toward 0.7023, and 0.6900 remains the structural floor for the whole advance. As long as 0.6920 holds, the ascending channel is technically alive regardless of what happens at the top.
Watch the Fed calendar too. The dollar reaction to the GDP beat on 2 September shows how quickly the Aussie technical picture can be overwritten by US data, and a hawkish surprise would take 0.7115 out before the divergence has time to develop.
Getting Started
- Open AUD/USD on the H4 chart in MT4 or MT5 and mark 0.7115, 0.7148, 0.7175 and 0.7207. Add RSI with the standard 14 period.
- Install the STS RSI Bot and set swing sensitivity so it identifies the highs you would identify by eye. Too sensitive and it fires on noise; too loose and it misses the setup entirely.
- Configure the stop at 25–30 pips above the signal high, first target at 0.7115, second at 0.7088.
- Backtest the configuration with the STS RSI Tester over at least the last six months of AUD/USD data.
- Run it on a demo account for two weeks before going live. Divergence setups are infrequent, so give the test enough time to actually produce signals.
Every setup in this article is built on levels that were live as of 2 September 2026. Levels move, so re-mark them before you deploy. If you want help matching the right bot to the way you already trade, get in touch with the STS team — we will walk through the parameters with you.