Solana Clears the $110 Wall and Prints a Seven-Month High
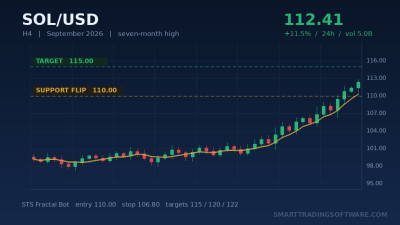
Solana spent the first half of September pinned inside a narrow band. On 17 September SOL was still changing hands near $100, with sellers defending $100.80 to $102 and the heavier wall at $108 to $110 untouched since February. Twenty-four hours later that picture had been redrawn. SOL traded at $112.41 on Friday evening, 18 September, up roughly 11.5% on the day and at its highest level in seven months, with volume pushing past $5 billion.
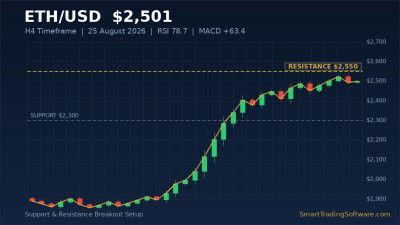
The move did not happen in isolation. Bitcoin added 6% to $81,166 and Ethereum reclaimed $2,500 to trade at $2,511 over the same session, so part of the SOL rally was simply beta to a broad risk-on day. But Solana outpaced both by a wide margin, and the reason shows up in the order flow rather than the headlines: derivatives positioning expanded sharply as price broke above its key moving averages, and the ETF bid that started building in August has not gone away.
What makes this worth trading rather than chasing is the structure underneath. On-chain data shows more than 40 million SOL changed hands in the $100 area during August's grind, which is an unusually dense block of cost basis. Holders sitting on a 12% gain from that level are far more likely to add on a dip than to dump into it. That is what turns a horizontal line on a chart into a support level with something behind it.
Trading the $110 Flip with a Fractal-Based Framework
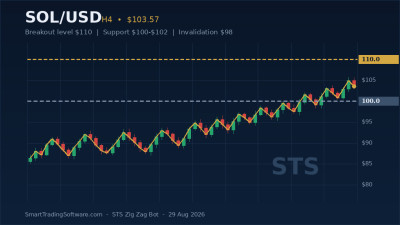
The cleanest way to trade a breakout of this type is not to buy the breakout candle. It is to wait for the retest. The $108 to $110 band capped Solana for seven months; now that price has closed above it, that same band becomes the first line of defence for buyers. Classic polarity — old resistance, new support.
The trade, then, is a long entry on the first controlled pullback into $110, with the invalidation sitting just under the next shelf at $107. Risk stays tight, the reward is the run at $115 and then the upper channel edge near $122, and the setup either works within a session or two or it does not work at all. That last property matters more than traders usually admit, because a setup that fails fast is a setup you can size properly.
Entry Parameters
Limit buy in the $109.50 to $110.50 zone on the retest. If SOL never comes back, a secondary trigger is a 4-hour close above $115.00 on rising volume, which confirms the next resistance shelf has also given way. Avoid market entries in the middle of the range between $112 and $114 — that is the part of the move where you are paying for someone else's edge.
Stop Loss Placement
Stop below $106.80, just under the $107 shelf. From a $110 entry that is roughly 2.9% of risk. If $107 goes, the flip has failed and the next real bid sits at the $100 cost-basis block, another 6% lower — not a level you want to discover while still in the position.
Take Profit Targets
Scale out rather than picking one exit. First target $115.00, the immediate resistance that came into focus the moment $110 cleared: take a third there. Second target $120.00, roughly 3:1 reward-to-risk from a $110 entry. Final target $122.00 at the upper edge of the rising channel, where partial profits make more sense than conviction. Move the stop to break-even once $115 trades.
Why This Setup Belongs on an Automated System
A retest entry is a poor fit for a human trader, and it is worth being honest about why. Crypto does not keep office hours. The $110 retest could print at 03:00 on a Sunday, last eleven minutes, and be gone. Watching for it manually means either missing it or sitting in front of a screen in a state that produces worse decisions, not better ones.
The STS Fractal Bot is built for exactly this pattern. It maps swing highs and lows straight off price structure, so the $108 to $110 shelf and the $115 ceiling are identified by the chart rather than typed in by hand, and it watches for a reaction at those levels around the clock on MT4 and MT5. When the retest prints, the order goes in with stop and targets already attached.
Scaling out of three targets is the other place manual traders quietly leak the edge, usually by closing the whole position at the first one. The STS Open Trade Bot handles that side of it: partial closes at each level, the stop moved to break-even once $115 trades, and a trail behind structure on the remainder — none of which requires you to be awake.
Key Solana Levels to Watch
Resistance above: $115.00 is the immediate objective. Above it, $120.00 and then $122.00 at the channel's upper edge. Clearing $123.00 would open the door to the $132 shelf and, on a sustained run, the $150 area that longer-term forecasts have been pointing at on the back of network growth and ETF inflows.
Support below: $110.00 is the flipped level and the one that defines this trade. Beneath it, $107.00, then the $100.00 cost-basis block where roughly 40 million SOL changed hands. A loss of $100 would expose $93 to $95 near the 50-day average, with $85.79 the next structural floor below that.
Momentum context: RSI(14) read 54.40 before the breakout — a genuinely neutral figure, meaning this move started from coiled energy rather than an already-extended position. The flip side is that a single 11% day pushes short-term oscillators toward overbought quickly, so a pause or a shallow retrace into $110 is a more likely next step than immediate continuation.
Getting Started
- Mark $110.00 and $115.00 on your SOL/USD chart as the two zones that matter, and set an alert on each.
- Backtest the retest rules on the last six months of Solana data before committing capital. The STS Zig Zag Tester replays swing-to-swing behaviour across historical data, so you can see how previous level flips actually resolved on SOL instead of assuming this one will.
- Configure the bot with your zones, a stop under $106.80, and the three scale-out targets.
- Size the position so the 2.9% stop costs no more than 1% to 2% of the account. Crypto volatility does the rest of the work for you.
Solana breaking a seven-month ceiling is the kind of setup that resolves quickly in either direction, which is exactly when having the rules written in advance and the execution automated pays for itself. If you want help matching an STS bot to your account size and risk tolerance, get in touch with our team and we will walk you through the configuration.