Bitcoin Defends $76,871 and Reclaims the $78,000 Handle
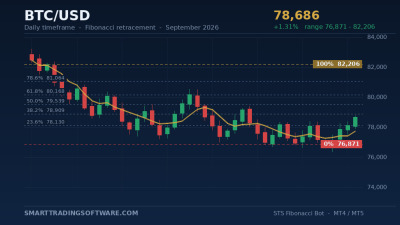
Bitcoin is trading around $78,686 on Wednesday, 2 September 2026, up roughly 1.31% on the session and about $1,800 above the low that now anchors the entire structure. That low — $76,871, printed on 31 August — is the most important number on the daily chart right now. September opened at $78,154.66, and every attempt to push price back under the month-open has been absorbed within hours rather than days.
The order flow behind the bounce is what makes this more than a routine dip. Sellers were absorbed near $77,165 on heavy volume, and positive delta has since realigned with rising price — the signature of a genuine reversal attempt rather than a short-covering pop. The 200-day moving average is still sloping up and still sits below spot, which means the longer-term trend has not been broken by the August drawdown. It has only been tested.
Momentum, meanwhile, is deliberately unexciting. The daily RSI sits inside the 30–70 neutral band, which is exactly what you want before a retracement resolves: no overbought exhaustion to fade, no oversold capitulation to catch. Price is working its way back up through a decline that has very clean endpoints — and clean endpoints are what make this a Fibonacci problem rather than a guessing game.
The Retracement Grid: Anchoring $82,206 to $76,871
Draw the retracement from the $82,206 swing high down to the $76,871 low and the whole August range measures 5,335 points. The levels that fall out of it line up with the horizontal structure traders were already watching, which is the only reason a Fibonacci grid is worth drawing at all.
- 23.6% — $78,130. Price reclaimed this on the bounce and has held above it. It sits just under the $78,340 acceptance level analysts are using as the first confirmation that the low is in.
- 38.2% — $78,909. The immediate ceiling. BTC at $78,686 is currently pinned between this and the 23.6% line.
- 50% — $79,539. The midpoint, and it sits directly beneath the $79,730–$79,920 shelf that rejected the last two rally attempts. That is the cleanest confluence on the chart.
- 61.8% — $80,168. The golden ratio and the level that usually decides whether a bounce becomes a trend reversal.
- 78.6% — $81,064. Last defence before the range high.
On the downside the arithmetic is equally clean. Lose $76,871 on a daily close and the retracement is void — the next real demand zone is $73,891, with very little in between. Above the range, a confirmed close through $82,206 opens a measured path toward $97,278. More conservative monthly models put the September ceiling nearer $83,428, while the Bitcoin Rainbow Chart projects roughly $87,000 by 30 September. The honest read: $82,206 is the trigger, and the two sessions after it decide which of those targets is realistic.
Trading the Grid with a Fibonacci Bot
A retracement with defined anchors, a neutral RSI and levels that overlap existing horizontal structure is the textbook use case for level-based automation. The STS Fibonacci Bot handles exactly this: you set the swing anchors, it draws and monitors the grid, and it executes the reaction without asking how you feel about that day's headlines.
Entry rules
Two setups worth arming. The continuation long triggers on a confirmed close above the 38.2% level at $78,909 — confirmed meaning a daily close, not an intraday wick, because BTC fakes through these lines often enough that close-confirmation pays for itself. The pullback long triggers on a retest of the 23.6% level at $78,130 that holds, which is the higher-low structure bulls need to see anyway.
Stop loss placement
For the pullback long, the stop belongs below $76,500 — far enough under the $76,871 floor to survive a liquidity sweep, close enough that you are out well before $73,891 comes into play. That is roughly 2.1% of risk from a $78,130 entry. For the continuation long, tighten the stop to $77,900, just under the 23.6% line, which should act as support once the 38.2% level is cleared.
Take profit and targets
Scale out on the grid rather than guessing. First target is the 50% line at $79,539, second is 61.8% at $80,168, and the runner goes to $81,064 at the 78.6% retracement. From a $78,130 entry with a stop at $76,500, that first leg alone is close to a 1:1 reward-to-risk ratio, and reaching the 61.8% target takes it past 1:1.2 — enough to move the stop to break-even and let the rest work toward the $82,206 range high.
Position sizing and filters
Bitcoin trades around the clock, but the moves that matter cluster around the U.S. cash open and the daily close. Set a session filter so the bot is not chasing thin Asian-session wicks, and cap risk at 1–2% of account equity per position. On a setup where invalidation is only about 2% away, that is not conservatism — it is the difference between a bad week and a bad quarter.
Why Automation Matters More on This Setup Than Most
Retracement trades punish hesitation in a specific way. The edge lives in the first few minutes after price touches a level. Wait for the reaction to become obvious and the reward-to-risk that justified the trade has already collapsed. Enter early because it "looks like" a bounce and you catch every knife on the way to $73,891. There is a narrow window in which the trade is correct, and it does not care whether you happen to be awake.
The psychological argument is sharper still. The 23.6% line at $78,130 will be retested, and it will be retested on a day when the news flow makes buying it feel stupid. A bot with the grid pre-loaded does not read the news. It reads the close.
Two tools make the grid more reliable. The STS ATR Level Indicator sizes stops to actual volatility instead of a fixed point value — useful when BTC daily ranges swing between $1,200 and $3,000 in the same week, which is precisely what happened through late August. And before committing capital, run the swing logic through the STS Zig Zag Tester to check how the same anchor-detection would have picked highs and lows across the August decline — the move that produced these levels in the first place.
Key Levels to Watch
Resistance: $78,909 is the 38.2% retracement and the immediate ceiling. $79,539 (50%) sits under the $79,730–$79,920 shelf that capped the last two attempts — treat that band as one zone rather than two lines. $80,168 is the 61.8% golden ratio, and $81,064 the 78.6%. Above all of it, $82,206 is the breakout trigger and the only level that genuinely changes the September outlook, with $85,000 and $87,000 as near-term projections and $97,278 the measured extension.
Support: $78,130 is the 23.6% retracement and the first line bulls need to defend. $77,165 is the absorption low where buyers initially stepped in. $76,871 is the structural floor — it has to hold on a closing basis for any of this to remain valid. Below that, $73,891 is the next meaningful demand zone.
Context: the rising 200-day moving average sits below spot and continues to slope upward. While that holds, dips into the $76,871–$77,165 band are corrections within an uptrend rather than the start of a new leg lower. A daily close beneath the 200-day expires the thesis on this page and turns the setup into a short-side problem instead.
Getting Started
- Open BTC/USD on the daily chart in MT4 or MT5 and draw a Fibonacci retracement from the $82,206 high to the $76,871 low.
- Confirm the grid prints $78,130, $78,909, $79,539, $80,168 and $81,064 — if your levels differ, your anchors are wrong.
- Add the STS ATR Level Indicator so stop distances track current volatility rather than a fixed number of points.
- Backtest the swing-detection logic over the August decline with the STS Zig Zag Tester before risking capital.
- Attach the STS Fibonacci Bot, load the anchors above, and set risk to 1–2% per trade with a session filter enabled.
- Run it on demo for a full week. If $78,130 gets retested in that window, you will learn more about the setup than any backtest can tell you.
Bitcoin has handed traders something rare this month: a retracement with anchors that are actually defensible. $76,871 below, $82,206 above, a Fibonacci grid whose 50% line lands on the exact shelf that has rejected price twice, and an RSI that has not yet picked a side. Whether this resolves upward toward $87,000 or breaks down to $73,891, the levels are known in advance — which is precisely the condition under which automation earns its keep. If you want help configuring the bot for your account size and risk tolerance, get in touch with our team and we will walk you through the settings.