XRP Defends the $1.35 Demand Zone as ETF Money Comes Back
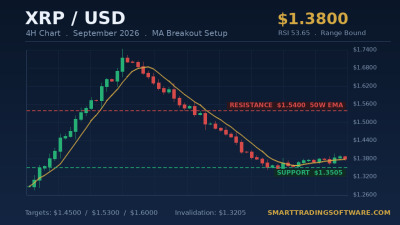
XRP is trading near $1.38 as September 2026 gets underway, sitting directly on top of the $1.35 to $1.39 band that has absorbed every serious selling attempt of the past three weeks. That zone matters for a reason beyond simple price memory. Roughly 3.2 billion XRP has changed hands inside it, which makes it the densest block of cost basis anywhere on the chart. Holders who bought there are close to break-even, and traders who are close to break-even tend to add rather than capitulate.
The wider context is a market still digesting a violent move. XRP rallied 71.8% off the $0.988 low to a $1.698 high, then handed back roughly 20% of that advance. What followed was not a collapse but a grind, and the tape has been quietly improving underneath it. The 14-period RSI reads 53.65, just above its own recent average. That is constructive momentum without the overbought stretch that preceded the August fade. MACD has turned up as well, although the histogram is thin enough to argue for patience rather than aggression.
The bid is not purely technical either. US spot XRP ETFs took in $110.49 million of net inflows in the week ending 28 August, the first week above $100 million since the week ending 5 December 2025. Institutional demand on that scale does not guarantee a breakout, but it does change the character of the dips.
How to Trade the XRP Range Into the 50-Week EMA
The structure in front of traders is unusually clean, which is exactly the kind of chart that suits a rules-based approach. Support is stacked between $1.3505 and $1.39, with hard invalidation at $1.3205. Overhead sits the 50-week exponential moving average at $1.53 to $1.54, a level that has capped every recovery attempt since January. Above it are $1.60, $1.68 and $1.86.
That geometry produces two distinct trades from one chart: a mean-reversion long from the demand zone, and a momentum long if and when the weekly EMA finally gives way. Mixing the two is where most discretionary traders lose money, because the entry logic and the stop logic are completely different.
Trade A: Long From the $1.35 Demand Zone
Entry is a limit order in the $1.3550 to $1.3700 pocket, ideally on a 4-hour candle that wicks into the zone and closes back above $1.3700. Stop loss goes below $1.3180, a little under the $1.3205 structural break, which keeps the trade out of the obvious liquidity sweep. First target is $1.4500, the mid-range magnet. Second target is $1.5300 at the EMA. Risk on the first leg is roughly 3.8% with about 6.5% of upside to target one, so the ratio works at roughly 1:1.7 and improves to better than 1:4 if the second target fills.
Trade B: The $1.54 EMA Breakout
This one requires confirmation rather than anticipation. The trigger is a daily close above $1.5400 with volume above the 20-day average, followed by a retest that holds $1.5300. Stop loss sits at $1.4950, below the breakout shelf. Targets are $1.6000, $1.6800 and $1.8600. The reason for demanding the retest is that XRP has produced three false pokes above the 50-week EMA since January, each one reversing within 48 hours. A single weekly close above resistance is the minimum bar for confirmation, and multiple weekly closes are what actually establish the level as support.
Position Sizing and Session Filters
Cap risk at 1% of account equity per idea and do not run both trades at full size simultaneously, since they are correlated to the same directional thesis. Crypto liquidity is thinnest between 00:00 and 04:00 UTC, and that window is where stop hunts around round numbers like $1.35 and $1.50 are most likely. A simple time filter that blocks new entries during those hours removes a meaningful share of bad fills.
Why Automation Beats Watching This Chart Manually
A range this well defined is easy to describe and hard to execute. XRP trades 24 hours a day, seven days a week. The $1.3550 retest may print at 03:00 on a Sunday, and the daily close above $1.5400 will not wait for anyone to be at their desk. Manual traders end up doing one of two things: chasing the move after it has already run, or sitting through the setup and taking the trade late with a wider stop.
This is precisely the problem the STS MA Breakout Bot was built for. The level that defines this whole thesis is a moving average, not an arbitrary line, and the bot automates strategies based on the breakout of a pre-selected MA on MetaTrader 4. Set the 50-week EMA as the trigger, require a close beyond it rather than a wick, and the $1.5400 decision gets taken by rules instead of by whoever happens to be awake.
The retest half of the trade is a separate job. Once price clears the EMA and pulls back into it, the STS MA Touch Bot handles entries triggered by price touching a selected moving average, which is exactly the $1.5300 pullback described above. Running the breakout and the touch logic as two configured bots keeps the two ideas from contaminating each other.
Before either goes live, the STS MA Distance Tester lets you replay how distance-to-MA rules would have behaved through the January, March and August rejections at this same average. Backtesting the losing scenarios is usually more informative than backtesting the winners, and XRP has supplied three clean failures to study.
Key XRP Levels to Watch This Week
The map is short and worth keeping on a sticky note.
Resistance: $1.5300 to $1.5400 is the 50-week EMA and the level that defines the whole thesis. Above it, $1.6000 is the first supply shelf, $1.6800 marks the prior swing high area, and $1.8600 opens the path toward $2.19 if momentum carries.
Support: $1.3900 is the near-term floor, $1.3550 sits mid-zone, and $1.3505 is the lower edge of the high-volume node. Below that, $1.3205 is the line that invalidates the constructive case and opens a deeper retest toward $1.2400.
Momentum: RSI at 53.65 leaves room in both directions. A push above 60 alongside a $1.54 breach would be the cleanest confirmation available. A slip below 45 while price is still inside the demand zone would be the earliest warning that support is thinning.
Getting Started With the XRP Setup
If you want to run this systematically rather than discretionarily, the sequence is straightforward.
1. Load XRP/USD on MT4 or MT5 with H4 as the working timeframe and D1 for the trend filter.
2. Mark $1.3205, $1.3505, $1.3900, $1.5400 and $1.6000 as static horizontal levels.
3. Backtest the rules with the STS MA Distance Tester across at least the last twelve months so the January and August EMA rejections are included in the sample.
4. Configure the STS MA Breakout Bot on the 50-week EMA with a 1% risk cap, the stop and target levels above, and the 00:00 to 04:00 UTC entry filter.
5. Run it on a demo account for two full weeks before committing capital, and review every trade the bot skipped as well as every trade it took.
XRP has spent eight months failing at the same moving average. The trade is not predicting which attempt finally works. It is being positioned, mechanically and with defined risk, for whichever side breaks first.
If you would like help configuring these levels for your account size or want to discuss which STS product fits your strategy, get in touch with our team and we will walk you through the setup.