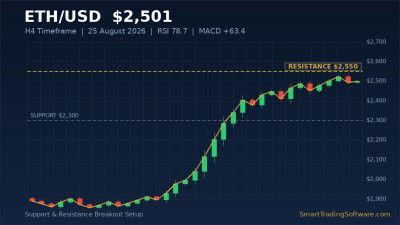
Ethereum at $2,501 — a 20% Week Runs Straight Into the $2,550 Wall
Ethereum is trading around $2,501 on Tuesday, 25 August 2026, up roughly 2.1% on the day and holding above the $2,500 handle after one of the strongest weekly advances of the year. A week ago ETH was still stuck in the $1,800–$1,900 band. It cleared the $1,980–$2,000 resistance shelf, gained about 17% in a single daily surge on the back of regulatory headlines, and pushed its weekly gain beyond 20%.
On 21 August the token printed $2,405 with an intraday high near $2,448. Over the weekend it ground higher and finally tagged $2,525 before settling back into the low $2,500s. That is the part traders should be watching. The $2,500–$2,550 band is not a random number — it is where the Murrey Math grid places the next major resistance, and it lines up with the supply left behind from the spring breakdown.
The momentum picture is the complication. Daily RSI spiked to 86.31 on 21 August, an extreme reading that historically precedes a pause rather than a clean continuation. It has since cooled to roughly 78.7 while price kept climbing, which is the healthier way for an overbought condition to unwind — momentum resetting through time instead of through a violent drop. The daily MACD histogram has expanded to +63.4, so the larger trend still has fuel. The 1-hour MACD, meanwhile, has flipped negative, which tells you intraday buyers are already tiring.
So you have a market that is structurally bullish, tactically stretched, and parked directly under a well-defined ceiling. That combination is exactly what an RSI-filtered breakout system is built for.
The $2,550 Breakout Setup Explained
Trading a level like $2,550 discretionarily is where most retail accounts get chopped up. The first touch produces a fake break, the trader chases, price snaps back into the range, and the stop gets taken. Then the real break happens two hours later without them.
The fix is not a better opinion about Ethereum. It is a mechanical rule set that defines what a valid break looks like before price gets there, and an execution engine that does not hesitate when it happens.
Entry Rules
Wait for a 4-hour candle to close above $2,550, not merely wick through it. A close-based filter eliminates the majority of stop hunts around round numbers. Ideally the breakout candle carries above-average volume and the daily RSI is below 80 at the moment of the break — a breakout printed with RSI at 86 is far more likely to be the exhaustion tick than the start of a leg.
Conservative traders can add a retest condition: enter on the first pullback that holds $2,500–$2,510 as new support after the break. Fewer signals, better fills, and a much tighter stop.
Stop Loss Placement
Place the stop below the breakout candle's low, or below $2,448 — the 21 August intraday high that now acts as the top of the prior range. If price returns underneath $2,448 the breakout thesis is dead and there is no reason to hold. From a $2,555 entry that is roughly a 4.2% stop, which is normal risk for ETH on a 4-hour structure. Size the position so this stop costs no more than 1–2% of the account.
Take Profit Targets
The first objective is $2,625, the level that opens up on a sustained break above $2,500. That is roughly a 2.7% move from entry — take partial profit there and move the stop to break even. The second target is $2,750, the next resistance shelf identified on the daily chart. A more ambitious extension sits at $2,885, which is where the longer-term Fibonacci cluster begins.
Invalidation for the whole bullish structure is a daily close back below $2,300. That is the floor of the $2,300–$2,400 support zone the rally built on the way up, and losing it would turn this from a consolidation under resistance into a failed breakout.
Why Automation Matters More on This Particular Setup
Ethereum trades 24 hours a day, seven days a week. The $2,550 break will not politely wait for a European or New York session — some of ETH's most decisive moves this month have happened during Asian hours and over the weekend. A manual trader either sits at the screen indefinitely or misses the signal.
The STS RSI Breakout Bot is built for precisely this pattern. It waits for a confirmed close beyond a defined level rather than a wick, and it can gate that entry behind an RSI condition — which is the whole point when the daily reading is still in the high 70s. Entry, stop and target go in as one action, so the bot does not talk itself into an early fill when price is grinding at $2,548 for the third time.
If you would rather anchor the trigger to trend structure than to a fixed horizontal, the STS MA Breakout Bot fires on confirmed closes through a moving average band. On ETH's current 4-hour chart the two approaches point at almost the same place, which is usually a sign the level is worth respecting.
For traders who want to keep the execution decision manual, the STS RSI MTF Indicator shows RSI across several timeframes on one chart. That matters here: the daily is stretched while the 4-hour has already cooled, and seeing both at once stops you from acting on the wrong clock.
Whichever route you take, backtest it first. The STS RSI Tester lets you replay the RSI filter across previous ETH breakouts — including the failed ones in March and May — so you know the historical hit rate before you risk live capital.
Key Levels to Watch
Resistance: $2,525 (recent high), $2,550 (Murrey Math major), $2,625, $2,750, $2,885.
Support: $2,500 (psychological, now pivotal), $2,448 (21 Aug high), $2,400, $2,300 (structural floor), $2,055.
The zone between $2,448 and $2,550 is the decision box. Ethereum has spent several sessions inside it, and the resolution — in either direction — is likely to be fast. Prediction market pricing currently puts roughly a 50% chance on ETH touching $2,600 during August and about a 48% probability that $2,300 support gets tested, which is a fair summary of how genuinely two-sided this is.
One more thing worth flagging: with daily RSI still near 79, a shallow pullback into $2,400–$2,450 that resets momentum without breaking structure would arguably be the better setup. Breakouts that launch from a cooled RSI hold far more often than breakouts that launch from an extreme.
Getting Started
- Open ETH/USD on a 4-hour MT5 chart and mark $2,448, $2,500, $2,550 and $2,625 as horizontal lines.
- Add the STS RSI MTF Indicator so you can see the daily and 4-hour RSI side by side before any trigger fires.
- Run the STS RSI Tester over the last six months of ETH data to measure how the close-confirmation filter would have performed.
- Configure the STS RSI Breakout Bot with a $2,550 trigger, stop below $2,448, first target $2,625, and risk capped at 1–2% per trade.
- Forward-test on a demo account for at least two weeks before going live. Crypto slippage on breakouts is real and your broker's spread behaviour matters.
Automation does not remove risk from an overbought market — it removes hesitation, fatigue and the temptation to widen a stop at the worst possible moment. Those three account for more losing months than bad analysis ever does.
If you are not sure which configuration suits your account size or broker, get in touch with our team and we will help you set up the right combination for your ETH strategy.