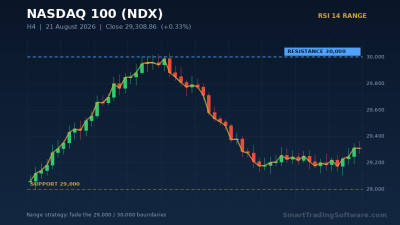
Nasdaq 100 Steadies at 29,544 as AI Earnings Meet a 4.8% Treasury Yield
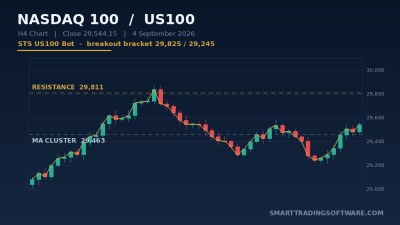
The Nasdaq 100 finished Friday, 4 September 2026 at 29,544.15, up 61.83 points or 0.21% on the day. The move itself was small. The location is not. That close sits roughly 80 points above the 29,463-29,465 moving-average cluster that has absorbed every pullback since late August, and about 270 points below the 29,811 swing high that has capped the index twice in the last two weeks.
The tug of war behind that stalemate is easy to describe. On one side is the AI capital expenditure cycle, which is still delivering: Broadcom beat estimates with earnings growth running close to 100% annualised, and the index closed the quarter with aggregate growth near 80%. Nvidia record numbers kept the semiconductor complex bid. On the other side is the bond market. The US 10-year yield added about five basis points last week to roughly 4.80%, and at one point futures priced a 66% probability that the Federal Reserve next move is a hike rather than a cut. Governor Christopher Waller has since said he would be inclined to hold rates steady absent an inflation surprise, which is why the index has drifted sideways instead of breaking down.
The price action reflects that indecision. The index bounced from a 29,260 low on 31 August to 29,540 on 1 September, sagged back to 29,286 on 3 September, then recovered into Friday close - more than 500 points of range covered for a net weekly change of almost nothing. RSI has been printing overbought readings on the daily, four-hour and 15-minute charts without producing an actual reversal. That combination, high momentum readings inside a contracting range, is the classic signature of a market coiling ahead of a catalyst rather than one that is topping out.
Trading the 29,811 Test With an Automated Breakout Bracket
A compressing range ahead of a data release is where discretionary traders tend to give back the most and where rule-based systems tend to earn the most. The reason is simple: the edge lives in the first ten to twenty minutes after the range breaks, and that is exactly the window in which a human trader is still deciding whether the move is real.
The STS US100 Bot was built for this instrument specifically, which matters more than it sounds. Index CFDs behave differently from currency pairs - the spread widens through the cash open, the overnight gap is real, and point-based stops that work on EUR/USD are meaningless here. Below is a parameter set adapted to the current Nasdaq 100 structure. Treat it as a starting point for your own backtesting, not as a signal.
Entry: Bracket the 29,260-29,811 Compression
Place a buy stop at 29,825, roughly 14 points above the 29,811 swing high, and a sell stop at 29,245, just under the 29,260 reaction low. The offsets matter: stops resting exactly on a round figure get picked off during the open auction. Configure the bot to cancel the opposite pending order once one side triggers, so a whipsaw does not leave you long and short in the same session.
Stop Loss: Behind Structure, Not a Fixed Distance
For the long, the natural invalidation is a close back inside the range, so a stop around 29,655 works - roughly 170 points of risk, sitting below the last higher low rather than at an arbitrary round number. For the short, place the stop near 29,420, just above the moving-average cluster at 29,463. Anything tighter than about 120 points on this index is inside normal four-hour noise and will be taken out on a routine retest.
Take Profit: Two Fixed Targets and a Runner
On the upside, the first target is 29,887, the second is the 30,000 psychological level, and the runner aims for 30,360 - the measured move projected from the roughly 525-point range height added to the breakout point. On the downside, take the first partial at 29,368 where the 200-day moving average sits, the second at 29,100, and let the remainder work toward 29,022. Scaling out at two levels and trailing the balance keeps the reward-to-risk above 2:1 on the first target alone.
Filters Worth Applying
Two filters make a meaningful difference here. First, restrict entries to the London-New York overlap and the first two hours of the US cash session, when volume actually supports a breakout. Second, block new orders in the thirty minutes either side of CPI, PPI and the FOMC statement. Breakouts that fire into a data print are coin flips, and a bot that trades them will hand back a month of gains in an afternoon.
Why Automation Beats Manual Execution in This Structure
A range this tight resolves quickly. When 29,811 finally gives way, the first move to 29,887 can happen in a handful of one-minute bars. Manual traders miss it for predictable reasons: they are asleep, they are waiting for a retest that never comes, or they hesitate because the daily RSI still reads overbought. A bot has none of those problems. It has the pending orders working, the stop attached, and the partial exits pre-programmed before the candle even prints.
Automation also solves the opposite failure mode. Ranges produce false breaks, and each one is a small loss. Traders who take three of those in a row usually widen their stop or skip the fourth signal - which is invariably the one that runs. A system takes every signal at the same size and lets the distribution do its job. If you prefer a more generic engine you can point at any symbol, the STS MA Breakout Bot applies the same bracket logic around a moving-average band rather than a fixed swing high.
For an extra layer of confirmation before the break, the STS MA Distance Indicator is useful here because the entire setup is defined relative to the 29,463 moving-average cluster. It measures how far price has stretched from its moving average in points, which turns range compression into a number rather than a visual impression. When that distance collapses toward zero and stays there, the breakout window is open.
Before committing capital to any of these parameters, run them through history. The STS MA Distance Tester lets you replay the distance-and-breakout logic across previous Nasdaq 100 ranges - the June consolidation, the August compression at 29,300 - and see what the false breaks actually cost. Roughly six months of four-hour data is enough to judge whether a 170-point stop is too tight or too generous for your account size.
Key Nasdaq 100 Levels to Watch
Resistance: 29,811 is the level that defines the setup - the swing high from late August and the trigger for the whole long scenario. Immediately above sits 29,887, then the 30,000 round number, which will attract option-related activity into the next expiry. A daily close above 30,000 opens 30,360 as the measured target.
Support: The 29,463-29,465 zone is where the 20-day and 50-day moving averages have converged, and it has held on three separate tests. Below it, the 200-day moving average at 29,368 is the line that separates a pullback from a trend change. Then comes 29,260, the 31 August low, followed by the 29,100-29,250 demand area and 29,022 beneath it.
Catalysts: The next CPI print and the FOMC statement are the two events capable of resolving this range in a single session. A softer inflation number takes the hike odds down from 66% and gives the AI trade room to push toward 30,000. A hot print sends the 10-year through 4.90% and puts 29,022 in play quickly. Trade the reaction, not the forecast.
How to Get Started
- Open the Nasdaq 100 (US100 or NAS100, depending on your broker) on the four-hour chart in MT4 or MT5 and mark 29,811 and 29,463 as horizontal lines.
- Install the STS US100 Bot and configure the bracket entries at 29,825 and 29,245 with the stop and target levels above.
- Add the STS MA Distance Indicator to the same chart to monitor how far price has stretched from the moving-average cluster.
- Backtest the configuration on at least six months of history with the STS MA Distance Tester before going live.
- Run the setup on a demo account through one full CPI or FOMC cycle, then size it at no more than 1% risk per trade when you switch to real money.
Every number above is a starting point drawn from the current chart, not a recommendation - your broker spread, your account size and your risk tolerance will all change the right settings. If you want help adapting these parameters to your own instrument or timeframe, get in touch with our team and we will walk you through it.