Nasdaq 100 Closes at 29,309 With 30,000 Still Unclaimed
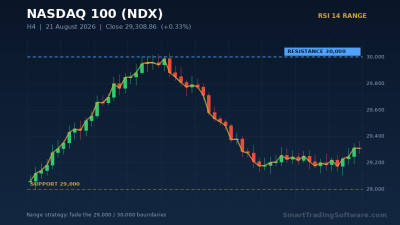
The Nasdaq 100 finished Friday, 21 August 2026 at 29,308.86, up 0.33% on the day after trading a 263-point band between 29,142.44 and 29,405.12. That is a quiet session by NDX standards, and it is a fair summary of the whole month. The index has repeatedly pressed toward the round number at 30,000 without ever closing above it, then drifted back into the middle of its range.
The wider context matters here. The 2026 high sits near 30,700, and that band has capped every rally attempt through the summer. Below the market, the channel support buyers defended earlier in the month comes in around 29,775, with the more important structural line at 29,553. Lose that and the next genuine shelf is 29,000, followed by 28,734 and 28,300. Between 29,000 and 30,000 the index has been rotating rather than trending, and it has been doing so for weeks.
Realised volatility near 25.5% annualised on thin late-summer volume tells the same story from another angle: plenty of movement, very little conviction. Semiconductor strength and the ongoing AI capital-expenditure cycle keep a floor under the tape, but the buying has not been broad enough to force a clean breakout. A number of desks now expect either continued consolidation at high levels or a corrective leg back toward the old swing high near 27,300 before the third quarter is out.
Trading a Range That Refuses to Break
Trend-following systems struggle in exactly this environment. A moving-average crossover strategy that worked beautifully during the spring advance gets chopped to pieces between 29,000 and 30,000, because each apparent breakout reverses within a session or two. What tends to work instead is a mean-reversion oscillator that fades the extremes of the range and stands aside in the middle of it.
The Relative Strength Index is well suited to that job. RSI measures how far and how fast price has moved relative to its own recent behaviour, which is precisely the question a range trader needs answered. Readings above 70 flag a stretched move higher, readings below 30 flag a stretched move lower, and the crossing back through those thresholds is the actual trigger — not the extreme itself.
Our STS RSI Bot for MetaTrader automates that sequence on any instrument your broker quotes, including index CFDs such as US100. It watches for the oscillator to reach an extreme, waits for the reversal cross, and only then places the order, which is the part most discretionary traders get wrong when they front-run the signal.
If you would rather not tune a general-purpose system to this specific index, the STS US100 Bot is built around the Nasdaq 100 itself, with position sizing and stop logic already calibrated to the way this index moves rather than to a generic FX pair.
Entry Parameters
On the four-hour chart, an RSI period of 14 gives a reasonable balance between responsiveness and noise on an index this liquid. Long setups become interesting when RSI drops below 30 while price is inside the 29,000–29,300 demand zone and then crosses back above 30. Short setups mirror that: RSI above 70 with price pressing 29,775–30,000, followed by a cross back below 70.
The location filter is not optional. An RSI extreme in the middle of the range, say around 29,450, carries far less information than the same reading at the edge, and taking every signal regardless of where it occurs is the fastest way to bleed a range strategy dry.
Stop Loss Placement
For longs taken near 29,150, a stop below 28,950 sits just under the 29,000 shelf and gives the trade room to survive a false break. For shorts initiated in the 29,900–30,000 zone, a stop above 30,120 keeps you out of trouble on a stop-run into the round number without exposing you to the full move toward 30,700 should the breakout prove real.
Roughly 200 index points of risk on a 29,300 index is about 0.7% — wide enough for current volatility, tight enough that a two-to-one reward target is realistic rather than aspirational.
Take Profit and Targets
Longs from the lower edge can scale out at 29,553, the structural line, with the balance running to 29,775. Shorts from the upper edge target 29,553 first and 29,300 second. Traders who prefer to hold for the full rotation can target the opposite boundary outright, though the hit rate falls as the target widens. A trailing stop that activates after the first target is reached is usually the better compromise.
Why Automation Helps Here
Range trading is psychologically awkward. It asks you to buy weakness and sell strength, which is the opposite of what recent price action feels like it is telling you, and it demands that you sit out the comfortable middle of the range where signals look plausible but pay nothing. Most traders eventually override the plan, usually right before the setup that would have worked.
An expert advisor does not have that problem. It takes the signal at the edge, skips the middle, and applies the same stop distance every time. Over a month of choppy conditions that consistency is worth more than any refinement of the entry rule itself.
Two supporting tools are worth pairing with it. The STS MA Distance Indicator quantifies how far price has stretched from its moving average in points or percentage terms, which gives you an independent read on whether an extreme is genuinely extreme or merely mildly overextended. And before committing capital, the STS RSI Tester lets you replay those RSI settings across historical data so you can see how a 14-period configuration behaved during the April indecision around 27,308 and through the summer range, rather than guessing.
Key Levels to Watch
Resistance stacks up at 29,775, then 30,000, then 30,250, with the 2026 high near 30,700 as the level that would confirm a genuine trend resumption. A daily close above 30,000 is the single most important signal on the chart right now; it would flip the range strategy off and hand the initiative back to trend systems.
Support runs 29,553, then 29,000, then 28,734, then 28,300. A decisive break of 29,000 opens the door to the deeper corrective scenario toward 27,300, at which point range assumptions should be abandoned entirely. Until one of those two boundaries gives way, the 29,000–30,000 band remains the operative structure.
Getting Started
- Open a four-hour NDX or US100 chart in MetaTrader and mark 29,000, 29,553, 29,775 and 30,000 as horizontal lines.
- Install the STS RSI Bot and set the RSI period to 14 with the 70 and 30 thresholds, or start with the STS US100 Bot if you want index-specific defaults out of the box.
- Add the STS MA Distance Indicator as a confirmation filter so that entries require both an oscillator extreme and a meaningful stretch from the mean.
- Backtest the configuration with the STS RSI Tester over at least the last six months of data before going live.
- Run it on a demo account for two weeks, then size positions so that a full stop costs no more than 1% of the account.
Ranges end, and this one will too — either through 30,000 or through 29,000. The advantage of an automated approach is that it keeps taking the edges cleanly while you wait, and it does not have an opinion about which way the resolution goes. If you want help matching a configuration to your account size and broker spreads, get in touch with our team and we will walk you through the settings.
This article is market commentary for educational purposes and is not investment advice. Trading indices and CFDs carries substantial risk of loss.