DAX 40 Slides to 25,839 as Bund Yields Hit Their Highest Since 2011
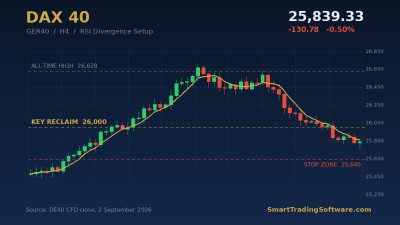
The DAX 40 closed Wednesday, 2 September 2026 at 25,839.33, down 130.78 points or 0.50%. It was the third consecutive losing session, and it leaves the German benchmark sitting at one-month lows, roughly 3.0% below the all-time high of 26,627.70 printed in late August. The index is down 0.62% over the past month but still 9.51% higher than a year ago. That combination matters: this is a pullback inside an uptrend, not a change of trend.
The pressure is coming from bonds and oil rather than from German earnings. Escalating US-Iran hostilities lifted Brent to $95.34 and WTI to $90.71, reviving inflation worries just as German CPI ticked up to 2.90% in August from 2.80%. Traders responded by pricing in a tighter ECB, and the 10-year Bund yield pushed to 3.3735% - its highest reading since 2011. Higher discount rates hit long-duration and rate-sensitive names first.
The internals confirm that read. Zalando fell 5.21%, Volkswagen dropped 3.83% after news that it will be removed from the Euro Stoxx 50 on 21 September, and Porsche Automobil lost 3.39%. Autos and energy-sensitive industrials carried most of the damage. On the other side, Qiagen added 2.31%, Commerzbank 1.70% and Rheinmetall 1.20%, while Adidas gained over 2% on a Barclays upgrade to Overweight and Deutsche Bank rose 1.8% after Goldman Sachs moved it to Buy. Banks outperforming while exporters are sold is a textbook rising-yield rotation, not a broad risk-off.
The macro picture is mixed rather than broken. German manufacturing PMI was revised up, Ifo business sentiment sits at a one-year high and Q2 GDP growth was revised higher, while retail sales slid 3.4% and unemployment held at 6.40%. Consensus macro models still project the DE40 at roughly 26,319 by the end of this quarter, which is above spot.
Why This Pullback Is a Textbook RSI Divergence Setup
Three red candles into a one-month low, with the selling driven by a macro headline rather than by deteriorating German fundamentals, is precisely the environment in which bullish RSI divergence tends to show up. Momentum sellers push price to a marginally lower low, but the conviction behind the move fades, so the 14-period RSI prints a higher low. When that happens near a level the market has already defended once, it is one of the more reliable mean-reversion signals available on an index chart.
The setup is credible here because nothing structural has broken. At 25,839 the DAX is still well above the January breakout near 24,771 and comfortably above the 23,000-24,500 base built earlier in the cycle. What has been lost is the August momentum leg, and divergence is the standard tool for timing when that leg tries to restart.
Entry Criteria
Work on the H4 chart. Wait for price to print a lower swing low while the 14-period RSI prints a higher low above its previous trough, ideally with that first RSI low below 30. Do not enter on the divergence itself. Enter on the H4 candle that closes above the swing high separating the two lows, which on current structure sits in the 25,940-25,970 area. A workable trigger is an H4 close above 25,950.
Stop Loss Placement
Place the stop one full daily ATR below the divergence low. DAX daily ATR is running near 300-340 points at these levels, which puts a practical stop at 25,640 - below both the divergence low and the round 25,700 shelf. From a 25,950 entry that is about 310 points of risk, so size the position such that the loss is 1% of the account or less.
Take Profit Targets
The first genuine hurdle is the round 26,000 level, which will be defended. Treat it as a checkpoint rather than a target: if the reclaim is real, price should hold above it on a retest. Target one is 26,320, the end-of-quarter consensus level and the mid-point of the August range, worth roughly 370 points or 1.2R. Target two is 26,628, the all-time high, worth roughly 680 points or 2.2R. Move the stop to breakeven once 26,000 has been cleared and held on an H4 close.
Why Automation Handles This Better Than You Do
Divergence trading fails for a fairly boring reason. It requires you to be at the screen at the exact moment a signal completes, and it requires you to buy when the tape looks its worst. The DAX cash session runs 09:00-17:30 CET with futures trading around it, and the H4 closes that actually matter rarely land at a convenient hour.
The STS RSI Bot scans for the pattern continuously, applies the confirmation-candle rule, and places entry, stop and both targets in a single action on MT4 and MT5. It does not talk itself out of the trade because the headlines are ugly, which is the whole point - the headlines are always ugly at a divergence low.
Two supporting tools are worth pairing with it. The STS MA Distance Indicator measures how far price has stretched from its moving average, which makes a useful filter: divergence signals that fire while price is unusually extended below the MA have a better hit rate than those firing in the middle of a range. And the STS RSI Tester lets you run the full rule set across DAX history before you commit capital, so the RSI period, ATR multiple and target distances come from data rather than from preference.
Key DAX 40 Levels to Watch
Resistance: 26,000 is the psychological line and the first real test of any recovery. 26,320 is the end-of-quarter consensus level. 26,440 marks the mid-August congestion zone. 26,628 is the all-time high.
Support: 25,800 is the immediate shelf, and Wednesday's close is sitting directly on it. 25,500 is the next round defence. Below that, 25,135 was the late-May consolidation zone and 24,771 is the January breakout level that turned the trend higher. A daily close under 25,135 would invalidate the bullish divergence thesis and shift the bias to range-bound.
Watch Brent alongside the index. The current weakness is oil-and-yield driven, so a pullback in crude back below $92 would take much of the pressure off the ECB rate path and is the most likely catalyst for the reclaim.
Getting Started
- Open a DAX 40 / GER40 H4 chart in MT4 or MT5 and mark 25,640, 25,950, 26,000, 26,320 and 26,628.
- Add RSI(14) and confirm the lower-low-in-price, higher-low-in-RSI structure before doing anything else.
- Backtest the rules across at least two years of DAX history with the STS RSI Tester, and record the win rate and average R.
- Install the STS RSI Bot and set RSI period 14, ATR stop multiple 1.0 and the two targets above.
- Forward-test on a demo account through at least one full ECB decision or German CPI print before going live.
Indices move quickly when yields are the driver, and the difference between a 2.2R trade and a missed one is usually a few minutes of attention you did not have to give. If you want help matching the right bot and settings to your account size and risk tolerance, get in touch and we will walk you through it.