Nikkei 225 Slips to 65,150 as JGB Yields Punch Through 3%
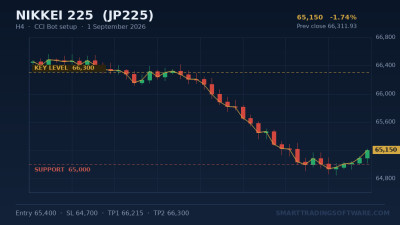
The Nikkei 225 finished Tuesday, 1 September 2026 at 66,215, down 0.15% on the day, while the broader Topix pushed 0.62% higher to 4,182. That split tells you most of what you need to know about this tape: value and financials are being bought, exporters and semiconductor names are being sold, and the price-weighted Nikkei is carrying the damage. The CFD contract that tracks the index has since slid to roughly 65,150, a 1.74% drop from the previous settlement of 66,311.93.
The trigger is coming from the bond market rather than the equity market. Japan's 10-year government bond yield climbed to around 3.00% this week, the highest reading since 1996, as Tokyo money markets moved to price a Bank of Japan rate hike at the 18 September meeting. Odds there now sit above 80%, and a growing number of desks are positioning for a second move in December. The policy rate is currently 1.00%, July inflation printed at 1.90%, and the yen is parked at 160.01 per dollar, close enough to the intervention zone that the Ministry of Finance is being asked about it daily.
Oil is not helping. Brent has advanced for a second straight session to $91.96 after renewed hostilities around the Strait of Hormuz, which for a net energy importer like Japan feeds straight into the import-cost story the BoJ is trying to contain. Index heavyweights took the brunt of it: Fujikura fell 3.7%, Tokyo Electron 2.6% and Recruit Holdings 3.95%, while Toyota (+2.76%) and the megabanks held up.
Step back, though, and this is a pullback inside a strong uptrend, not a reversal. The Nikkei is still up 2.2% over the past month and roughly 54% year-on-year, and the all-time high of 73,007 was only set in June 2026. That combination — an intact trend with sharp, headline-driven swings inside it — is precisely the environment where a momentum oscillator earns its keep.
The CCI Setup for a 66,300 Reclaim
The Commodity Channel Index measures how far price has travelled from its statistical mean. Despite the name it was never really about commodities, and on an index like the Nikkei it does one job very well: it separates a genuine momentum thrust from noise inside a range. Readings above +100 mark unusual strength, readings below -100 mark unusual weakness, and the crosses back through those thresholds are where the tradeable information sits.
Right now the H4 chart has price stretched to the downside after the yield shock, with the index roughly 1,000 points below Tuesday's cash close. The setup is a mean-reversion long: wait for the oscillator to register the exhaustion, then take the cross back up as the signal that sellers have run out of fuel.
Entry Trigger
Use CCI(14) on the H4 chart. The long trigger is a close above 65,400 that coincides with CCI crossing back above -100 from below. Do not anticipate the cross. The value of the -100 threshold is that it filters out the shallow dips that resolve sideways; entering early gives that filter away for nothing. For a more conservative version, require the cross plus a close above the previous four-hour candle's high.
Stop Loss
Place the stop below 64,700, roughly 450 points under the entry. That sits underneath the round-number 65,000 handle, which is where a fair amount of protective selling will be resting, and gives the position enough room to survive a single volatile Tokyo open. On a standard 1% risk model with a 0.5 lot index CFD, that translates to a manageable position size for most retail accounts — size the trade to the stop, never the other way around.
Take Profit Levels
First target is 66,215, Tuesday's cash close, which is the level the index needs to recover to neutralise the sell-off. Second target is 66,300, effectively the prior settlement at 66,311.93 and the line that turns this from a bounce into a reclaim. A runner can be left toward 66,500. That gives roughly 800 to 1,150 points of reward against 450 of risk, a ratio between 1.8:1 and 2.5:1 before costs.
Timing Filters
Two dates matter more than any chart pattern this month. The BoJ decision on 18 September is a binary event, and holding an index position through it is a coin toss rather than a strategy. Flatten before the announcement and re-enter afterwards. Intraday, avoid the first 30 minutes of the Tokyo cash open, where gap noise routinely triggers CCI crosses that mean nothing by lunch.
Why This Belongs in an Automated System
The mechanical problem with a CCI reclaim setup is that the signal fires when the chart looks worst. On 1 September, the moment the oscillator turned was also the moment the headlines were about 30-year yield highs and missiles near Hormuz. Very few traders click buy in that window, and the ones who do have usually talked themselves out of the level and into a worse entry.
The CCI Bot removes the argument entirely. It monitors the oscillator on your chosen timeframe, executes the cross when it happens, and places the stop and targets in the same instruction — no hesitation, no revenge entry, no manual re-plotting of levels at 3am Tokyo time. It runs on MT4 and MT5 and works on index CFDs, FX and metals with the same rule set.
Before committing capital, run the parameters against history. The Indicators Tester lets you replay CCI thresholds across previous Nikkei drawdowns and see how a -100 cross performed through the April and June volatility rather than assuming it would have worked. Traders who prefer to confirm momentum with a second, independent read often pair the setup with the MA Distance Indicator, which quantifies how stretched price is from its moving average — a useful cross-check that the oscillator signal is genuine exhaustion and not the start of a fresh leg down.
Key Levels to Watch
Resistance: 66,215 is the immediate ceiling, being Tuesday's cash close. Above it, 66,300 (the prior settlement at 66,311.93) is the level that confirms the sell-off has been absorbed, followed by 66,500. The June record at 73,007 is the longer-term reference but is not in play this month.
Support: 65,000 is the psychological floor and the first line worth defending. Below that, 64,000 opens up quickly given how thin the price action has been on the way up, and 63,000 is where the August advance would be fully retraced. A sustained close under 64,000 invalidates the reclaim thesis and turns the bias neutral.
Cross-market tells: watch USD/JPY around 160.00 and the 10-year JGB at 3.00%. If the yen strengthens sharply through 158 on hawkish BoJ commentary, exporters lose their tailwind and the Nikkei's floor tends to move lower with it.
How to Trade It
- Open the Nikkei 225 (JP225) H4 chart in MT4 or MT5 and mark 65,000, 66,215 and 66,300.
- Add CCI with a 14-period setting and draw the +100 / -100 threshold lines.
- Backtest the -100 cross across the last six months of Nikkei data using the Indicators Tester before risking anything live.
- Install the CCI Bot, set entry at the CCI cross above -100, stop at 64,700 and targets at 66,215 and 66,300.
- Run it on demo through at least one full week, including a Tokyo open, to confirm spread and slippage behaviour on your broker's index feed.
- Diarise 18 September and set the bot to stand down around the BoJ decision.
Nothing here is a forecast, and no level is a guarantee — the point of a rule-based system is that it keeps executing consistently whether the next headline goes your way or not. If you want help matching the CCI Bot's parameters to your account size, broker or preferred index, get in touch with the Smart Trading Software team and we will walk you through the configuration.