S&P 500 at 7,677 — Squeezed Between the 200-Day and the 50-Day
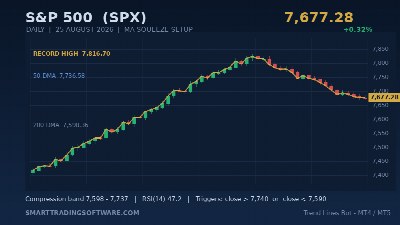
The S&P 500 closed Tuesday, 25 August 2026 at 7,677.28, up 0.32% on the session. On its own that is an unremarkable number. Where it sits on the chart is not. The index is wedged between its 50-day moving average around 7,736.58 above and its 200-day moving average around 7,598.36 below — a band of roughly 138 points, or about 1.8% of index value.
The record high for this cycle printed at 7,816.70 and has not been reclaimed since. The 14-day RSI is sitting near 47.2, which is about as close to the middle of the range as that indicator ever gets. Momentum is neutral, price is neutral, and the two moving averages that most desks watch are converging on each other.
That combination is what a squeeze looks like shortly before it resolves. It rarely stays this quiet for long.
Why This Is a Squeeze, Not a Trend
Trend-following logic works when price is pulling away from its averages. Right now it is doing the opposite. The 50-day has rolled over and is drifting down toward price after the July highs, while the 200-day continues to grind higher from the spring lows. Price is caught in the middle of that pincer.
For a mechanical system this is the worst possible environment. A plain moving average crossover will fire, get stopped, fire again in the opposite direction and get stopped a second time, all inside a 1.8% range. What actually carries information in a compression like this is not the cross itself but the distance between price and each average, and how fast that distance is changing.
There is one detail worth flagging. The heaviest one-hour order-density level on the index sits at 7,595.80 — effectively on top of the 200-day at 7,598.36. Confluence that tight is uncommon. It means the downside trigger is unusually well defined: if that shelf gives way on a closing basis, there is very little structural support until 7,300, and below that 7,000.
On the upside the map is equally clean. 7,800 is the round-number magnet, 7,816.70 is the record, 7,850 marks the upper boundary of the ascending channel drawn off the spring lows, and 8,000 is the next psychological objective. Strong earnings and continued upward profit revisions are the fundamental argument for that side of the trade.
Trading the S&P 500 Squeeze: A Rules-Based Plan
The plan below is deliberately boring. In a compression the edge comes from refusing to act inside the band, not from clever entries.
Long trigger and entry
Wait for a daily close above 7,740 — just through the 50-day. An intraday poke does not count; the close is the filter that removes most of the noise. Enter on the open of the following session, or on a shallow pullback into 7,720–7,740 if one is offered in the first two hours.
Short trigger and entry
Wait for a daily close below 7,590, which clears both the 200-day and the order-density shelf in one move. Same rule on the close. Entry on the next open, or on a retest of 7,595–7,610 from underneath.
Stop-loss placement
For longs, the stop belongs below the opposite side of the band, not a fixed number of points away. Roughly 7,575 — under the 200-day and under the order shelf — keeps you out of a false breakout that immediately reverses through the range. That is about 165 points of risk from a 7,740 entry.
For shorts, mirror it: a stop around 7,760, above the 50-day. About 170 points of risk from 7,590.
Both of those are wide by day-trading standards, which is the point. Size the position off the stop distance rather than forcing a tight stop into a range that is 138 points wide. Risking 1% of account equity per trade at that stop distance is a reasonable starting frame.
Targets
Long side: first target 7,816 (the record), second 7,850 (channel top), runner toward 8,000. Take roughly a third off at each, and move the stop to breakeven once 7,816 trades.
Short side: first target 7,500, second 7,300, runner toward 7,000. The 7,300 shelf is where dip buyers have historically shown up, so that is the level to be defensive around rather than the one to hold out for.
Why Automation Helps More Than Usual Here
Squeeze setups punish discretion in a specific way: the wait is long, then the resolution is fast. Traders who watch a 138-point band for a week tend to talk themselves into an early entry somewhere in the middle of it. A system does not get bored.
The Trend Lines Bot is built for exactly this handoff. It maps the moving average structure and channel boundaries, then only acts on a confirmed close through them — which is the rule most people break manually. On MT4/MT5 index CFDs it will sit flat through the compression and take the break when it comes.
For reading the compression itself, the MA Distance Indicator is the more useful tool. Instead of plotting the averages and leaving you to eyeball the gap, it plots the distance between price and the average as its own series. When that reading compresses toward zero on both the 50 and the 200 at once, you are in the setup described above — and when it starts expanding, the squeeze is resolving. On the current S&P 500 chart that reading is close to its narrowest of the quarter.
Key Levels to Watch
Resistance: 7,736.58 (50-day), 7,800 (round number), 7,816.70 (record high), 7,850 (channel top), 8,000.
Support: 7,690–7,700 (local), 7,598.36 (200-day), 7,595.80 (order-density shelf), 7,500, 7,300, 7,000.
The two that matter are 7,740 and 7,590. Everything between them is noise until one of them closes.
Getting Started
- Load the S&P 500 CFD daily chart in MT4 or MT5 and mark 7,740 and 7,590 as horizontal lines.
- Add the MA Distance Indicator against both the 50 and 200 period averages so you can see the compression numerically rather than by eye.
- Backtest the breakout rules on the last two years of index history with the Indicators Tester before committing capital. Pay attention to how many false closes the filter would have taken.
- Run the Trend Lines Bot on a demo account through at least one full resolution of the range, then size up gradually.
One caveat worth stating plainly: compression setups have a well-known failure mode, which is the false break that closes back inside the band within two sessions. If that happens, the correct response is to stand down and wait for the second attempt, not to reverse immediately.
If you want help matching a bot or indicator to the way you actually trade indices, get in touch with our team and we will walk you through the options.
This analysis is for educational purposes only and is not investment advice. Trading leveraged index products carries substantial risk of loss. Levels and prices cited are as of 25 August 2026 and will change.