Solana Clears $100 and Holds It — SOL Trades at $103.57
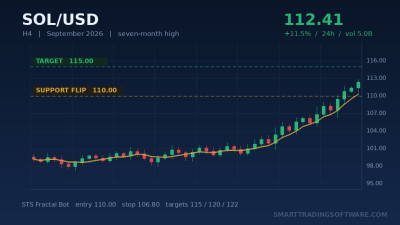
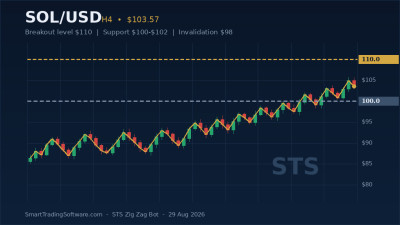
Solana is trading around $103.57 on Saturday, 29 August 2026, after a session that ran as high as $107.77 and found a floor at $102.48. That puts SOL roughly 17% higher over the past week and caps off the strongest monthly advance the token has posted in years. More importantly for anyone trading levels rather than headlines, it is the first time since the start of the 202-day accumulation range that price has closed a full day above the $100 psychological barrier and stayed there.
The catalyst was not subtle. U.S. spot Solana ETFs pulled in $33.49 million on 24 August — the strongest single day of demand in over eight months — and the week finished with roughly $65.74 million in net inflows, the highest weekly figure recorded for spot SOL products in 2026. Market cap now sits near $60.48 billion. Institutional bid plus a technical level that had rejected price twice is exactly the combination that produces the kind of expansion move we saw this week.
But the chart is not clean. The daily RSI printed near 79 during the push into the $107 area, which is deep into overbought territory, and the two earlier attempts at $102–$103 both failed to hold a daily close. So the question is not whether Solana is strong — it clearly is — but whether the $105–$110 band gets absorbed or rejected. That is a swing-structure question, and swing structure is what a zig zag system is built to read.
Why $105–$110 Is the Level That Actually Matters
Underneath price there is now a stack of well-defined supports that were resistance until very recently. The Murrey Math levels at $93.75 and $87.50 both capped advances earlier in the cycle and were cleared on this run. Below those sit $86.99, $83.20, $80.18 and $76.68. The immediate structural floor, though, is the $100–$105 zone — the ceiling that just flipped. Price behaviour inside that band over the next few sessions tells you whether the breakout is real.
Above, the picture is layered. Immediate resistance runs $105–$110. A sustained daily close above $110 opens the $115–$120 region, and the broader $125–$130 supply zone becomes relevant only if momentum holds through that. Each of those is a place where a mechanical strategy either takes profit or stands aside — not a target to hold blindly through.
The practical risk here is the retest. Breakouts of a 202-day range rarely go straight up. A pullback into $100–$102 that holds is constructive and is arguably the higher-quality entry. A daily close back under $98 invalidates the breakout and puts $93.75 back in play. Those two outcomes need different responses, and they can happen inside the same 24 hours.
Trading the $110 Breakout with a Zig Zag Bot
The setup fits a swing-structure system almost exactly. Every level that matters here — $107.77, $102.48, $98, $93.75 — is a confirmed swing high or swing low, which is precisely what a zig zag algorithm isolates from the noise between them. The STS Zig Zag Bot maps those pivots automatically and then trades either the break of the last swing high or the reaction off the last swing low, depending on how you configure it — without you needing to sit in front of the chart at 3am when the next ETF flow numbers land.
Entry Rules
Two viable entries. The breakout entry triggers on a confirmed H4 or daily close above $110, with the bot waiting for the candle to close rather than firing on the wick — this matters, because $107.77 was already tagged and rejected once. The pullback entry triggers on a bullish reaction inside the $100–$102 retest zone, once a new higher swing low is confirmed there. Setting the pivot depth wide enough that intraday chop does not register as a swing is the single most important parameter on this instrument right now.
Stop Loss Placement
For the breakout entry, place the stop below $105 — under the lower edge of the resistance shelf price just cleared, roughly $5 of SOL risk from a $110 fill. For the pullback entry, the stop belongs below $98, since a close under that level invalidates the whole breakout thesis. Do not tighten it to $100 exactly; the round number will get swept. If you would rather size the stop off realised volatility than off a fixed level, the STS ATR Level Indicator plots volatility-scaled bands directly on the chart, which is a more honest stop distance on a token that just moved 17% in a week.
Take Profit Targets
Scale rather than hold for one number. First target is $115, at the lower edge of the next resistance band, which gives roughly 1:1 from a $110 entry with the $105 stop. Second target is $120, at the top of that band. Third, and only if momentum through $120 is accompanied by continued ETF inflow, is the $125–$130 supply zone. Moving the stop to breakeven once $115 prints turns the remainder into a free option, which is the right way to handle a trade sitting on an RSI of 79.
Why Automating This Beats Watching the Chart
Crypto does not respect your sleep schedule. Solana's $100 break happened across a weekend session, and the $107.77 high and $102.48 low were roughly five hours apart. A manual trader either sat through both or missed the setup entirely. An expert advisor holds the pivot definition, the confirmation requirement and the stop placement in exactly the same form at every hour of the day.
There is also the discipline problem. An RSI at 79 makes traders do one of two unhelpful things: chase because the move looks unstoppable, or refuse the entry entirely because it looks extended. Neither is a rule. A bot with a written entry condition takes the trade when the condition is met and does not take it when it is not.
Before any of that goes live, the configuration needs testing against the range it will have to survive. The STS Zig Zag Tester replays the pivot logic across historical data so you can see how many false swings the settings would have produced during the 202-day accumulation phase — which is the honest test, because that period is full of exactly the failed breaks this setup has to filter.
Key Levels to Watch This Week
Resistance: $107.77 (this week's high), $110 (breakout confirmation), $115, $120, then the $125–$130 supply zone.
Support: $102.48 (session low), the $100–$102 retest band, $98 (invalidation), $93.75 and $87.50 (Murrey Math), then $86.99, $83.20, $80.18 and $76.68.
The two prices that decide the next fortnight are $110 and $98. Everything between them is noise you should be sized to survive.
Getting Started in Four Steps
- Mark $110, $105, $102, $100 and $98 on your SOL/USD chart on the H4 and daily timeframes, and check where your broker's SOL feed actually sits — crypto CFD pricing drifts a little between venues.
- Install the STS Zig Zag Bot on a demo account, set close-based confirmation, and widen the pivot depth until the swings it marks match the levels above rather than every intraday wiggle.
- Backtest that configuration across the accumulation range using the STS Zig Zag Tester before you commit capital.
- Size for a $98 invalidation, not a $105 one. If a 5% adverse move from entry would hurt, the position is too large for a token that has just repriced this quickly.
Solana reclaiming $100 after a 202-day range is a genuine structural event, but the trade is in the levels, not the narrative. If you want help setting the pivot depth, the confirmation filter or the risk parameters for your account size, get in touch — we will walk through the settings with you.