EUR/USD Holds 1.1667 as 1.1710 Refuses to Break
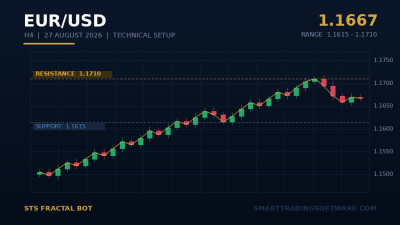
EUR/USD is trading around 1.1667 on Thursday, 27 August 2026, effectively flat on the week and sitting only a handful of pips under the 1.1710 high that has capped every push higher since Monday. Tuesday and Wednesday both closed inside a narrow band, which is usually what happens when the market has already decided that the information it actually cares about arrives later in the week.
That information is Jackson Hole. The Kansas City Fed's symposium runs from today through Saturday, 29 August, and it is Kevin Warsh's first as Chair. Rate futures have spent the past fortnight leaning towards easing, but the dollar has not fully agreed. The Dollar Index is still hovering near 99.00, supported by high Treasury yields and by the safe-haven bid that followed the latest expansion of US sanctions against Iran.
On the other side of the trade, the euro finally has a hawkish story of its own. The ECB sits at 2.40% and the market is now pricing a move to 2.50% in September, with a slow path towards 3.00% priced further out. Eurozone inflation at 2.8% is well below the 3.5% print in the United States, but stubborn energy costs are keeping the Governing Council's hawks vocal. That divergence — a Fed that may be preparing to cut from 3.75% while the ECB prepares to hike from 2.40% — is the engine behind the euro's climb away from the 50-day SMA at 1.1508.
The daily chart is constructive without being euphoric. Price is above the 50-day EMA, above the Supertrend line, and has been carving out what looks like a bullish flag since mid-August. Daily RSI sits near 55: comfortably bullish, nowhere near exhaustion. The caveat lives on the four-hour chart, where Tuesday printed a shooting star directly on the upper Bollinger Band and the short-term oscillators are stretched. Something has to give, and it will most likely give this weekend.
Trading the 1.1615–1.1710 Range With the STS Fractal Bot
This is not a trending market. It is a well-defined box with a hard ceiling at 1.1710, an intermediate shelf at 1.1670, and a floor at 1.1615 that has been tested twice this month without breaking. Those boundaries were not drawn by hand — they are the last confirmed swing highs and swing lows on the four-hour chart, which is exactly what a fractal reads.
That makes the STS Fractal Bot the right tool for the next few sessions rather than a trend-following system that will get chopped to pieces inside the range. The bot marks each confirmed fractal high and low as it forms and trades the reaction to those levels, so the box it is trading updates itself as the structure changes instead of relying on lines you drew last Tuesday.
The logic is simple enough to state in one sentence: fade the edges until the box breaks, then trade the break. The difficulty is not knowing that — it is executing it at 3pm on a Friday when a Fed Chair is halfway through a speech and the spread has just tripled.
Entry
Two setups are live. The breakout entry triggers on a four-hour close above the 1.1710 fractal high, confirming that the week's ceiling has genuinely gone rather than being wicked through by a headline. The reversion entry triggers on a rejection at the 1.1615 fractal low, with the bot requiring a confirmed bounce rather than a simple touch. Arm only one of the two at a time; running both into an event-risk window is how a clean range strategy turns into a whipsaw generator.
Stop Loss
For the breakout long, place the stop at 1.1650, just below the 1.1670 shelf. That is roughly 60 pips of risk and it sits underneath the level that has to hold if the breakout is real. For the range long from 1.1615, a stop at 1.1565 gives the trade room to breathe above the deeper 1.1554 and 1.1534 supports without exposing you to the full drop towards the 50-day SMA.
Take Profit
The breakout long targets 1.1805 — the next structural resistance and the level that has to clear before 1.1915, the 2026 high, comes back into the conversation. That is a reward-to-risk ratio comfortably above 1:2. The range long is more modest: 1.1710 as the first target, with a partial close at 1.1670 for anyone who prefers to bank something on the way. If the pair breaks 1.1615 to the downside instead, the mirror trade targets 1.1565, then 1.1503.
Why Automation Earns Its Keep in an Event Week
Jackson Hole is the worst possible environment for discretionary execution. Levels get tested during illiquid moments, spreads widen without warning, and the temptation to move a stop "just this once" is at its strongest precisely when the setup is working. An automated system does not negotiate with itself.
Stop placement deserves a second look this week. Fixed 50-pip stops behave very differently on a quiet Wednesday than they do ten minutes into a Fed Chair's speech, and a stop that was sensible on Monday can be inside the noise by Friday. The STS ATR Level Indicator plots stop and target distances from current volatility rather than from a fixed pip count, which is a far more honest way to size the risk on a setup like this one.
Before putting any of this on a live account, run the parameters through the STS Zig Zag Tester. EUR/USD has produced several ranges of this shape in 2026, and backtesting the 1.1615–1.1710 configuration against those earlier episodes will tell you far more about your stop placement than any single forward trade will.
Key Levels to Watch
Above the market: 1.1670 as the immediate shelf, 1.1710 as the week's ceiling and the real breakout trigger, then 1.1805, and finally the 2026 high at 1.1915. Nothing meaningful sits between 1.1710 and 1.1805, which is why a clean break of the ceiling tends to travel.
Below the market: 1.1615 is the floor that matters. Beneath it, 1.1565 and 1.1554 sit close enough together to act as a single band, with 1.1534 and 1.1503 behind them. The 50-day SMA at 1.1508 reinforces that last zone, so a move down there would be the first genuine test of the medium-term uptrend since July.
The calendar matters as much as the chart this week. US PCE lands before the symposium wraps up, and the ECB accounts have already given the hawks something to point at. Either can move the pair 80 pips before a confirmation candle even closes, which is the argument for wider stops rather than tighter ones over the next three sessions.
Getting Started
- Open EUR/USD on the H4 chart and mark 1.1710, 1.1670 and 1.1615. These three levels define the entire setup.
- Install the STS Fractal Bot on a demo account and let it confirm the fractal high at 1.1710 and the fractal low at 1.1615 before you enable trading.
- Set the stop and target values from the sections above, then confirm the lot size keeps risk per trade under 1% of account equity.
- Add the STS ATR Level Indicator so your stop distance reflects this week's volatility rather than last month's.
- Backtest the configuration in the STS Zig Zag Tester across the June and July ranges before going live.
- Reduce position size for the Friday session. Warsh speaks, and first speeches from a new Chair have a habit of being read three different ways in the space of an hour.
The euro has spent August grinding higher on a rate-differential story that is genuinely changing, but the 1.1710 ceiling has held four times now and it will take more than momentum to clear it. Trade the box until the box breaks. If you would like help configuring the bot for your broker's spread and session times, get in touch with our team — we will walk you through the settings.