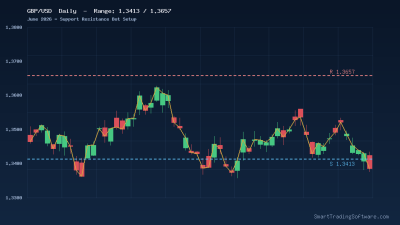
GBP/USD Pinned Near 1.3450: Why the 1.3657 Resistance Matters Now
As of early June 2026, GBP/USD is trading around the 1.3433–1.3450 area, hugging both its 5-day moving average at 1.3433 and its 50-day moving average at 1.3430. The 14-day RSI sits at 56.4, which is constructive but far from overbought, and MACD is flat at zero. In other words, Cable is coiled inside a tight consolidation, and the chart is starting to look like a pressure cooker rather than a trend.
The pair is now squeezed between two well-defined boundaries. On the downside, 1.3413 (the May 22 swing low) is the immediate floor, with 1.3375 as the next layer if sellers push through. Above price, 1.3657 stands out as the key intraday resistance, with the heavier 1.38–1.42 supply zone still capping all rallies in 2026. A clean daily close above 1.3657 would be the first meaningful break of structure since price stalled in May, and that is exactly the kind of setup that rewards a rules-based approach.
Trading the GBP/USD Range Break with a Support & Resistance Strategy
The most reliable way to play a market like this is to stop trying to predict the direction and instead let price tell you. When GBP/USD spends weeks inside a 240-pip envelope, the edges of that envelope are the entire trade. The plan is simple: fade tests of the range while it holds, and switch to breakout mode once price closes outside the boundary with momentum.
Long Setup (Bullish Break of 1.3657)
Wait for a daily close above 1.3657. Entry on a pullback to the broken level, ideally with the 4-hour RSI above 55 and the 50-day MA sloping up. Initial stop loss below 1.3520 (roughly 140 pips of risk). First target at 1.3800, second target at 1.3900, with the 1.4248 cycle high as a stretch objective if momentum carries.
Short Setup (Failed Break, Range Holds)
If price prints a wick above 1.3657 but closes back inside the range, that is a textbook fade. Short on the rejection candle close, stop loss above 1.3720, first target 1.3500, second target 1.3413. If 1.3413 breaks on a daily basis, trail the position toward 1.3375 and 1.3300.
Position Sizing
Cap risk at 1% of account equity per trade. With a 140-pip stop on the long setup, that means roughly 0.7 standard lots on a $100,000 account. Discipline on size matters more than being right on direction, especially in a range where false breaks are common.
Why Automate This Setup Instead of Watching Charts All Day
Range trading sounds easy on paper and is brutal in practice. The setup requires constant monitoring of two specific price levels, confirmation on the close of a specific timeframe, and an instant entry on the retest. Miss the close by a few hours and the move is gone. This is exactly the kind of mechanical, rules-driven workflow that an Expert Advisor handles better than a human staring at a screen.
Our Support & Resistance Bot is built for this exact pattern. It automatically detects horizontal supply and demand zones on the chart, waits for a confirmed close beyond the level, and executes the breakout or fade according to your configured rules. The companion Support & Resistance Indicator is the same engine running in chart-only mode, useful if you prefer to keep the final click manual but want clean, repeatable level identification.
Before you let any of this run on a live account, backtest it. The Indicators Tester lets you replay the Support & Resistance logic across months of historical GBP/USD data, so you can see how the strategy would have handled the May consolidation, the November 2025 squeeze, and every false break in between. Walk-forward results matter more than any forecast.
Key Levels to Watch on GBP/USD This Week
The chart distills to a short list of numbers. Above price: 1.3657 is the breakout trigger, 1.3800 is the first measured-move target, and 1.4248 is the long-term ceiling. Below price: 1.3413 is the line in the sand, with 1.3375 as backup support and 1.3300 as the major medium-term floor. The 5- and 50-day moving averages stacked at 1.3430–1.3433 act as a magnet inside the range – expect price to gravitate there until one side breaks.
RSI at 56 leaves room to run in either direction, so do not lean on momentum as a directional bias yet. Watch for an RSI push above 60 on the daily as the early tell that a 1.3657 break is being prepared. Conversely, an RSI drop below 45 while price holds 1.3413 would warn that a range break could resolve to the downside instead.
Getting Started: A Practical Three-Step Plan
Step 1: Mark 1.3657 and 1.3413 on your GBP/USD daily chart and stop trading anything in between unless it is a confirmed fade off either edge. Step 2: Install the Support & Resistance Bot on a demo account and let it run for at least two weeks to confirm the level detection matches your manual marking. Step 3: Run the same configuration through the Indicators Tester across the last six months of M30 and H4 data, then ramp to a small live size only after the backtest matches your expectations.
The GBP/USD setup heading into June is one of the cleaner range-break opportunities on the major Forex board right now. If you would like help configuring the bot for the specific 1.3413/1.3657 levels, or want a custom backtest report sent to you, contact our team and we will walk you through it.