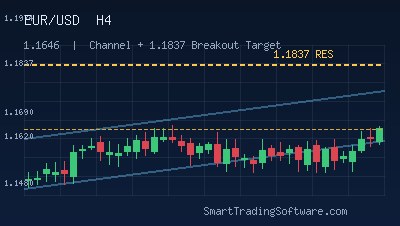
EUR/USD at 1.1646 Coils Inside Ascending Channel Ahead of 1.1840 Test
EUR/USD is trading near 1.1646 in early June 2026, holding inside the ascending channel that has guided price action higher since the March low. The 5-day moving average sits at 1.1646 and the 50-day moving average is virtually flat with it at 1.1645, a compression that almost always resolves with a sharp directional move. The 14-day RSI prints 52.8 — squarely neutral — while shorter-frame momentum has crept up toward 58, hinting at quietly improving conditions under the surface.
The structure is what makes this setup interesting. Near-term resistance is layered between 1.1660 and 1.1690, with the September 2025 swing high at 1.1837 acting as the gatekeeper to the broader 1.1950-1.2000 zone. On the downside, 1.1660 and the deeper 1.1480 floor define the line in the sand for bulls. Forex.com flagged the 1.1705-1.1685 pocket as the optimal accumulation area, with risk tightly defined under 1.1650 — a level traders should respect rather than argue with.
The Trend Lines Strategy: Riding the Channel, Trading the Break
The cleanest way to play this regime is to treat the ascending channel itself as the trade. Price has respected its lower boundary four times since March, and each touch has produced a clean bounce of 90-130 pips. A disciplined trend-line strategy buys those touches, exits into the upper rail or into the obvious horizontal resistance, and gets out of the way when the structure breaks.
Entry Triggers
Two entries deserve attention this week. The first is a pullback long into 1.1620-1.1640, anchored on the rising trend line drawn from the March pivot. This entry needs confirmation — a rejection wick on the H4, RSI lifting back above 50, and ideally a bullish engulfing candle on the H1 close. The second is a breakout long above 1.1690, the upper edge of the immediate consolidation, which would open the path toward 1.1837 with little overhead supply in the way.
Stop Loss and Take Profit
For the pullback long, the stop belongs just under 1.1610, beneath the prior swing low — a roughly 30-pip risk that respects normal H4 noise without bleeding capital on every wobble. First target sits at 1.1690 (a 50-pip move and roughly 1.6R), with the runner targeting 1.1837 for a clean 6R outcome if the channel holds. The breakout entry above 1.1690 uses a tighter stop near 1.1665, with the same 1.1837 target translating to a much more favourable 5R-plus reward.
Why Automation Beats Discretion in This Setup
The hardest part of a trend-line strategy is not finding the line — it is sitting on your hands until price actually reaches it. Manual traders constantly redraw, second-guess, and front-run their own setups, which kills the edge before it has a chance to play out. A bot that holds the line for you, only fires when price actually touches the geometry you defined, and applies the stop and target mechanically is a far more honest expression of the strategy.
That is exactly the job of the Trend Lines Bot — it lets you draw the channel rails directly on the chart, then handles entry and risk management automatically when price interacts with them. For traders who want to layer a momentum filter on top, the RSI Divergence Bot only takes longs when RSI confirms with a bullish divergence at the lower rail, which filters out the obvious traps in a sideways tape. Before sending either to a live account, it is worth running the parameters through the Indicators Tester on the last six months of EUR/USD H4 data to make sure the channel touches you backtest were not just three lucky coincidences.
Key Levels to Watch This Week
The level map for the next five sessions is tight. On the upside, 1.1660 is the immediate hurdle, 1.1690 is the trigger, 1.1837 is the September 2025 high and the real prize, and 1.1974-1.2000 is the multi-month objective if the Fed-ECB policy divergence keeps weighing on the dollar. On the downside, 1.1650 is the line-in-the-sand for the bullish setup, 1.1620 is the channel rail, 1.1480 is the structural floor, and a daily close beneath it would invalidate the broader uptrend and shift the bias short.
The MACD reading at 0.000 underlines the indecision — neither bulls nor bears have committed yet. That is precisely the kind of compression that resolves with a clean impulse, which is why having mechanical triggers in place beats waiting for confirmation that only arrives in hindsight.
Getting Started with the EUR/USD Trend Lines Setup
If you want to deploy this setup on your own MetaTrader 4 or MT5 account, the workflow is straightforward:
- Install the Trend Lines Bot on EUR/USD H4 and draw the ascending channel from the March 2026 low through the most recent two confirmed lows.
- Set the pullback entry zone at 1.1620-1.1640 and the breakout trigger at 1.1690, with stops at 1.1610 and 1.1665 respectively.
- Configure first target at 1.1690 (pullback entry) or 1.1837 (breakout entry), and a runner partial at 1.1974.
- Optionally pair with the RSI Divergence Bot on the same chart as a confirmation filter.
- Backtest the combined setup through the Indicators Tester on at least three months of historical H4 data before committing live capital.
The setup is clean, the levels are defined, and the risk is bounded — exactly the kind of geometry that automation handles better than discretion. If you have questions about parameter tuning for your account size or want help validating the backtest, the team is one click away on the contact page and happy to walk through it.