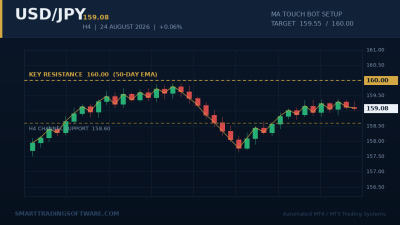
USD/JPY Tests the 160.00 Intervention Wall: Current Setup at 159.19
USD/JPY is once again pressing against the politically loaded 160.00 handle. As of late May 2026, the pair trades near 159.19 after recovering roughly 80% of the losses inflicted by two intervention rounds in late April and early May that reportedly totalled more than $60 billion. Price has been coiling just below the 160.00 figure since the second half of March, building a tight consolidation that typically resolves with sharp directional movement.
The technical picture is a classic squeeze. Daily momentum is neutral-to-bullish: the 14-period RSI is sloping up just above 50, while the MACD line has clawed back toward the zero line after spending most of May in negative territory. Bulls have repeatedly tested the 159.35 area, last reached on May 21, but Tokyo's verbal intervention threats and a softer US dollar index above 104.20 have capped follow-through. A clean push through 160.71, the prior swing high, would technically open the door to the 164 level that JP Morgan projects for year-end.
RSI Multi-Timeframe Strategy: Trading the 160.00 Resolution
Single-timeframe RSI readings are not enough on a pair this politically charged. Intervention risk creates sudden 200-pip candles that destroy isolated chart setups. A multi-timeframe (MTF) approach to RSI helps filter false breakouts by requiring agreement across the H1, H4, and Daily charts before triggering a position. When the Daily RSI is above 50, the H4 RSI is rising, and the H1 RSI confirms momentum on the breakout candle, the probability of a sustained move improves materially.
Long Setup Parameters
For the bullish breakout scenario, the trigger is a Daily close above 159.65 with both the H4 and H1 RSI registering above 55. Entry on the next candle open near 159.80 keeps risk defined. Stop loss should sit beneath the May 21 swing pivot at 158.95, giving the trade roughly 85 pips of breathing room. The first take profit targets the 160.71 prior high, while a runner can be left to chase the 162.00 round number if Tokyo stays on the sidelines.
Short Setup Parameters
The bearish scenario activates if 157.30 minor support breaks on a Daily close with the Daily RSI rolling under 45. Entry near 157.10 with a stop above 158.20 keeps risk to 110 pips. First target is the 155.01 swing low, with the 200-day moving average at 153.80 as a secondary objective. This is the structurally cleaner trade because it aligns with the underlying intervention bias.
Why Automation Matters on USD/JPY Right Now
USD/JPY sessions overlap awkwardly for European and US-based discretionary traders. The most decisive moves often happen during the Tokyo fix at 00:55 GMT, the London open at 07:00 GMT, and during US data releases at 12:30 GMT. Manually monitoring three RSI timeframes across these windows is impractical and emotionally taxing, particularly when intervention headlines can move 150 pips in seconds.
This is where the RSI Multi Time Frame Bot earns its keep. It continuously evaluates RSI alignment across user-selected timeframes and only executes when the configured agreement is met, removing the lag between signal and order placement. Pair it with the MA Distance Indicator on a separate chart window to monitor how stretched price is from the 50- and 200-period moving averages, which is a useful overextension filter on yen pairs.
Key Levels to Watch This Week
The levels that matter for any USD/JPY plan in the next five sessions are the ones the price action keeps respecting. On the upside, 159.35 is the immediate hurdle, with 160.00 acting as the psychological and intervention threshold and 160.71 as the technical breakout trigger. On the downside, 158.95 is the May 21 pivot, 157.30 is minor support, 155.01 is the prior swing low, and 153.80 is the 200-day moving average that institutional desks are watching as the trend pivot.
An intraday close that holds above 159.35 with H1 RSI above 60 would suggest the consolidation is resolving higher even before 160.00 cracks. Conversely, a failure at 159.35 followed by a break of 158.95 on rising volume would shift the bias to the short side and target the 157.30 zone first.
Getting Started with the RSI MTF Setup
Traders new to multi-timeframe RSI strategies on yen pairs can follow these steps to deploy the setup on a live or demo MetaTrader account:
- Open USD/JPY on the Daily chart and confirm the RSI(14) is above 50. If it is below 45, switch the bias to the short setup outlined above.
- Install the RSI Multi Time Frame Bot and configure the timeframes to H1, H4, and Daily with an RSI threshold of 55 for longs and 45 for shorts.
- Backtest the configuration on at least 12 months of M15 history using the RSI Multi Time Frame Tester to confirm the parameter set survives the April and May 2026 intervention bars.
- Attach the MA Distance Indicator to a second USD/JPY chart to monitor extension from the 50- and 200-period moving averages, and pause the bot if distance exceeds two standard deviations.
- Cap risk at 0.5% per trade given headline volatility, and configure the bot to flatten before any scheduled Bank of Japan press conferences.
USD/JPY at 159.19 is not the moment for unstructured discretion. The 160.00 wall is a binary event in either direction, and a disciplined multi-timeframe RSI framework is what separates traders who profit from the resolution from those who get caught in the noise. To discuss a customised bot configuration for your account size and broker, get in touch with our team and we will walk you through the setup parameters that fit your trading window.