EUR/USD Stalls at 1.1623 as Price Compresses Between Key Moving Averages
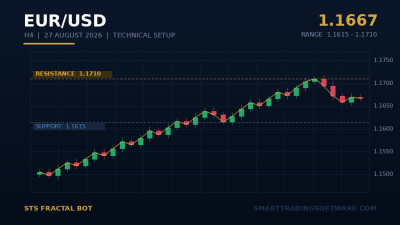
EUR/USD is trading at 1.1623 on May 28, 2026, hovering uncomfortably between the 5-day moving average at 1.1612 and the 50-day moving average at 1.1628. After failing to hold the pivotal 1.1680 support zone earlier this month, the single currency has slipped into a tight consolidation, with the 14-day RSI cooling to 43.5, a level that often precedes either an exhaustion bounce or a fresh leg lower.
The technical structure favored euro strength while price remained above 1.1680. Now that the pair has slipped below it, the market has flipped that level from support into immediate overhead resistance, with the next major decision points clustering at 1.1550, the March low at 1.1476, and on the upside the 1.1800 swing area followed by the broader 1.1974–1.2000 resistance shelf. For traders, this kind of moving-average compression is rarely permanent — and the way price separates from those averages will dictate the next 200-pip move.
The MA Distance Setup: Reading Compression Before the Expansion
When the 5-day and 50-day moving averages are stacked within 16 pips of each other, the market is effectively coiled. Standard moving-average crossover systems struggle here because every minor wiggle prints a false signal. The MA Distance Indicator solves this by quantifying the distance between price and any chosen moving average as a normalized oscillator, allowing traders to spot the moment compression flips into expansion — typically the cleanest entries in a sideways tape.
On EUR/USD right now, the indicator plots a near-flat reading as price oscillates around the 50-day MA. A decisive push that opens the MA-to-price distance above the recent 7-day envelope, combined with a 4H close back above 1.1680, would be the kind of expansion signal the indicator is designed to surface. Until then, the disciplined play is to wait for the structure to commit.
Long Setup: Bullish Reclaim Toward 1.1800
The first scenario is a higher-probability bounce play that depends on bulls defending the 1.1612 area. Specifically:
Entry: 1.1635 on a confirmed 4H close above the 5-day MA after MA Distance prints an expansion reading.
Stop loss: 1.1585, below the rounded 1.1600 psychological level and the recent intraday low.
Take profit 1: 1.1680 — the flipped support-turned-resistance, where partial profits are warranted.
Take profit 2: 1.1800 — the major resistance zone identified by every major desk this week.
Risk-reward: roughly 1:3.5 to TP2, which keeps the trade asymmetric even if only half the target is captured.
Short Setup: Bearish Continuation Below 1.1600
If sellers force a clean break of the 5-day MA and price prints a 4H close below 1.1600, the path of least resistance shifts toward the 1.1550 confluence and ultimately the March low.
Entry: 1.1595 on a retest of the broken 1.1600 area.
Stop loss: 1.1645, above the 50-day MA cluster.
Take profit 1: 1.1550.
Take profit 2: 1.1476.
Risk-reward: approximately 1:2.4 to TP2.
Why Automation Is a Better Fit for This Range
Tight consolidations are unforgiving for discretionary traders. The setup demands patience through dozens of low-conviction candles, then immediate execution the moment the trigger fires — usually outside London or New York session hours. An automated approach removes the emotional cost of waiting and the latency cost of acting late.
For range traders, the RSI Multi Time Frame Bot is particularly useful here because it confirms the H1 trigger against the H4 and D1 RSI alignment, filtering out the bait moves that have plagued EUR/USD over the past two weeks. Traders who prefer to validate the setup historically before going live should run it through the RSI Multi Time Frame Tester, which replays the bot's logic across multi-year data to expose how it handles compression-then-expansion cycles like the one EUR/USD is printing today.
For traders who want a second confirmation layer rooted in horizontal structure rather than oscillators, the Support & Resistance Indicator auto-plots the multi-timeframe S&R zones — including the 1.1680 flip level — so manual chart annotation is no longer required.
Key Levels to Watch This Week
The map for EUR/USD over the coming five sessions is fairly clean:
Resistance: 1.1680 (flipped pivot), 1.1750 (recent swing high), 1.1800 (major), 1.1974–1.2000 (year-to-date resistance shelf).
Support: 1.1612 (5-day MA), 1.1600 (round number), 1.1550 (volume node), 1.1476 (March low and macro pivot).
The catalysts capable of breaking the range are well known: any divergence between Fed rate-cut pricing and ECB hold messaging, the next U.S. core PCE print, and German bund auctions. None of these need to be predicted — the goal is simply to be positioned correctly once the move begins.
Getting Started With the EUR/USD Compression Trade
If the setup outlined above fits your trading plan, here is a sensible sequence to deploy it:
1. Install the MA Distance Indicator on a fresh EUR/USD H4 chart and set the moving averages to the 5 and 50 periods to mirror the analysis above.
2. Overlay the Support & Resistance Indicator to mark the 1.1680, 1.1612, and 1.1550 zones automatically.
3. Backtest the trigger logic on the RSI MTF Tester across the last 6 months of EUR/USD data to confirm the expectancy holds for this regime.
4. Deploy the RSI Multi Time Frame Bot on a demo account first, then size up only after at least 20 live signals have been collected.
5. Position-size each trade at no more than 1% of account equity given the inside-range nature of the setup.
If you'd like a tailored configuration of the MA Distance Indicator or guidance on which RSI MTF parameters fit your broker's spread profile, the SmartTradingSoftware team is available via the contact page. EUR/USD will eventually pick a direction — the only question is whether your toolkit is ready when it does.