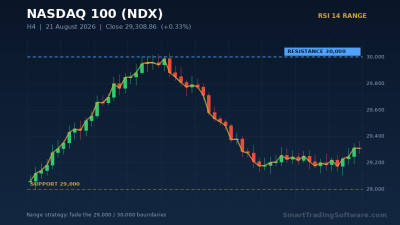
NASDAQ 100 Tests 30,000 Pivot as RSI Divergence Warns of Pullback
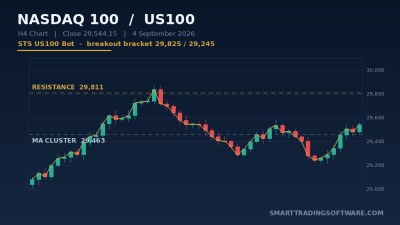
The NASDAQ 100 closed at 30,223.89 on May 28, 2026, capping a remarkable 27% rally from the late-March lows and pressing hard against the psychological 30,000 level for the third straight session. Tech leadership has been relentless, but warning signs are stacking up beneath the surface. A weekly "Spinning Top" candle, a break below the medium-term ascending channel support, and most importantly a clear bearish RSI divergence on the 4-hour chart are telling a different story than the headline tape.
The 14-day daily RSI is printing 64.5, still in buy territory but slipping from the overbought zone above 70 that it tagged earlier in the month. Each successive push toward the 30,425 medium-term pivot has come with a lower RSI peak, the textbook signature of fading momentum. Traders eyeing the next leg need to watch 28,660 as the first line of intermediate support and 27,850 just below it, which aligns with the 20-day moving average.
The RSI Divergence Setup: Why This Pullback Matters
Bearish RSI divergence at the top of a parabolic rally is one of the highest-quality reversal signals in technical analysis. Price prints a higher high, RSI prints a lower high, and the gap between them measures the rate at which buying pressure is exhausting. The current divergence on the NDX 4-hour timeframe formed between the May 18 peak near 30,560 and the May 28 retest at 30,224. RSI rolled over from 78 to 64 across that span, even as price held within 1.2% of the highs.
That kind of structural weakness rarely resolves with a sideways pause. The path of least resistance points to a corrective leg into the 28,660 to 27,850 demand zone, where dip buyers and trend-following algorithms are most likely to step in. For active traders, the question is not whether the pullback comes, but how to position for it with defined risk.
Short Entry Parameters
A clean short setup triggers on a 4-hour close below 30,050, confirming the rejection from the 30,425 pivot. Stop-loss sits above the swing high at 30,500, capping risk at roughly 1.5%. The first take-profit anchors at 29,200 for a 1:1.7 reward-to-risk ratio, with a runner targeting 28,660 for the full 1:3 trade.
Long Entry on Support Reclaim
If price flushes into 28,660 to 27,850 and prints a bullish reversal candle with positive RSI divergence on the 4-hour, that becomes a high-conviction long entry. Stop below 27,500, first target back at 29,500, second target retest of 30,425.
Why Automation Wins These Setups
Divergence trades demand patience and precision. The signal can take days to confirm, and the entry window often opens during the Asia or early London session when most discretionary traders are asleep. Worse, the same divergence pattern can repeat two or three times before it resolves, and missing the right one means watching a 1,500-point move from the sidelines.
An automated approach removes the timing problem entirely. The RSI Divergence Bot scans the 4-hour and daily charts in real time, flags qualifying divergence patterns, and executes trades only when momentum and price-structure filters both align. It runs on MetaTrader 4 and 5 with built-in money-management rules, so position size adjusts automatically to account equity and the volatility of the underlying index.
For broader confirmation, pairing the bot with the MA Distance Indicator highlights moments when price has stretched too far above the 20- and 50-period moving averages, exactly the condition that makes a divergence-driven pullback most likely to follow through. Before going live, the Indicators Tester lets you replay every NDX divergence signal from the past five years to validate that the parameters fit your risk tolerance.
Key Levels to Watch This Week
The technical map for the NASDAQ 100 is unusually clean heading into June. Above current price, 30,425 remains the medium-term pivot; a sustained breakout above this area would invalidate the bearish divergence thesis and open a path toward the 31,000 to 31,250 measured-move objective. 30,560 serves as the immediate swing high and the trigger for any continuation longs.
On the downside, the structure stacks like this: 30,050 is the short-trigger pivot, 29,500 is the first reactive support and a likely scalp-long zone, 28,660 is the intermediate support that aligns with the broken ascending-channel boundary, and 27,850 is the deep-support cluster anchored by the 20-day moving average. A weekly close below 27,850 would shift the medium-term bias from bullish-corrective to outright distributive.
Getting Started With This NDX Setup
To trade this RSI divergence opportunity systematically, follow these steps.
1. Install the RSI Divergence Bot on your MT4 or MT5 platform and attach it to the NDX or US100 chart on the 4-hour timeframe.
2. Add the MA Distance Indicator as a confirmation filter, set to the 20- and 50-period EMAs.
3. Backtest the configuration with the Indicators Tester using NDX data from 2021 through 2026 to confirm the strategy's edge across multiple regimes.
4. Start with a demo account or fractional position sizing for the first two weeks of live trading to validate execution.
5. Monitor the 30,425 pivot and 28,660 support daily; the bot will handle entries and exits, but knowing where price sits in the structure keeps you in control.
Questions about configuring the bot for your account size or broker setup? Reach out through our contact page and our team will help you fine-tune the parameters for the current NDX volatility regime.