S&P 500 Holds 7,519 Near Record High — CCI Bot Eyes a 7,600 Breakout Push
The S&P 500 closed at 7,519.12 on Tuesday after a fresh intraday all-time high of 7,549.6 on May 25, extending an uptrend that has dominated price action since early April. The index is now up roughly 8.5% on the year, with Q1 earnings growth of nearly 28% YoY underpinning a tape that refuses to give back ground. Momentum, however, is stretching: the daily RSI sits at 67 and printed above 70 on shorter timeframes, while the MACD continues to climb in positive territory. For traders, that combination — a coiling melt-up into prior highs — is exactly the kind of setup where mechanical execution beats discretion.
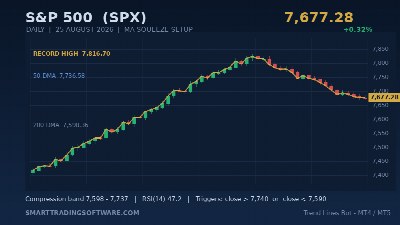
The technical map is clean. Immediate resistance is the May 25 swing high at 7,549, followed by the round-number magnet at 7,600 and a measured extension into the 7,650–7,700 zone. On the downside, the first cushion is the rising 20-EMA near 7,440, then the 7,300 horizontal pivot that has acted as a launching pad twice this month. Below that, 7,000 is the line in the sand for the broader uptrend. Anything inside this 7,440–7,550 range is a coil — and coils above all-time highs typically resolve in the direction of trend.
The Trade Setup: Trading the ATH Breakout with a CCI Filter
The strategy is straightforward: wait for a confirmed daily close above 7,549 with CCI(20) printing above +100, then enter on a controlled pullback. The Commodity Channel Index does two things particularly well in this environment. First, it filters false breakouts by demanding that momentum is genuinely positive at the point of breach, not fading. Second, when CCI re-tests its zero line after a breakout but holds, that retest often marks a high-probability continuation entry.
Entry Parameters
Primary entry: long on a daily close > 7,549 with CCI(20) > +100. Re-entry on the first 4H pullback that holds 7,500 with CCI(20) crossing back above +50 after dipping toward zero. Skip the trade if the breakout candle prints with a long upper wick exceeding 60% of its total range — that is rejection, not continuation.
Exit, Stop Loss and Take Profit
Initial stop: 7,478 (just under the rising 20-EMA and the prior week's low). That gives roughly 70 points of risk on the primary entry. First take-profit at 7,600 (round number), where it makes sense to reduce 50% of the position and trail the remainder. Secondary target sits at 7,650, with a runner target at 7,700 if the move develops with daily closes holding above 7,580. Risk/reward on the first leg alone runs better than 1:1.1, with the runner pushing the blended R-multiple toward 2.5.
Position Sizing and Invalidation
Risk no more than 1% of account equity per setup. The trade is invalidated — not just stopped — on a daily close back below 7,440, which would mean the breakout failed and the index is rotating back into the prior consolidation. In that case, the structural bias flips to neutral until 7,549 is reclaimed on a closing basis.
Why Automation Beats Discretion at All-Time Highs
All-time high environments are emotionally loaded. Traders hesitate at the breakout, chase the wick when it finally fires, and exit too early on the first pullback. An automated CCI-based system removes those biases entirely: it executes the rule, sizes the position consistently, and trails the stop without second-guessing. The CCI Bot implements exactly this kind of filtered breakout logic on MetaTrader 4 and 5, with adjustable CCI thresholds, configurable session windows, and built-in risk caps so a single bad day cannot blow up a position.
Before deploying any system on live capital around a record high, the right move is to backtest the parameters across multiple regimes — trend, range, post-correction recovery. The Indicators Tester lets you replay historical price on the S&P 500 cash index (or the equivalent CFD feed) and measure how the CCI(20) > +100 trigger has actually performed across the last several years of breakout attempts. The output is a hard equity curve, not a feeling.
For traders who want to layer a confluence filter on top of CCI, the MA Distance Indicator is a useful overlay. It flags when price has stretched too far from a chosen moving average — the kind of overextension that often precedes a fast mean reversion, even inside a strong uptrend. Combining a CCI breakout signal with a sane MA-distance ceiling typically improves the win rate of breakout trades materially.
Key Levels to Watch This Week
Above the market: 7,549 (ATH and breakout trigger), 7,600 (round-number resistance and first target), 7,650 (measured move extension), and 7,700 (psychological round number and runner target). Below the market: 7,500 (intraday pivot), 7,478 (stop level and 20-EMA), 7,440 (breakout invalidation), 7,300 (horizontal pivot and recent launch zone), and 7,000 (broader uptrend defense). The CAPE ratio at 41.6 — the second-highest reading in over 140 years — is a longer-term valuation concern, not a near-term timing signal, but it argues for keeping stops tight and not adding aggressively into extension.
Getting Started With a CCI Breakout System on the S&P 500
For traders ready to move from analysis to execution, a structured rollout looks like this:
- Install the CCI Bot on MetaTrader 4 or 5 and attach it to a US 500 / SPX500 chart on the daily timeframe.
- Set CCI period to 20, the breakout threshold to +100, and the re-entry threshold to +50 for the secondary trigger.
- Configure the stop-loss to 70–90 points and the first take-profit at the 7,600 round number; enable trailing on the runner portion.
- Load the Indicators Tester and validate the parameter set across the past 3–5 years of S&P data, paying particular attention to how the system handled the 2022 bear market and the 2024–2025 melt-up.
- Add the MA Distance Indicator to the chart and disable new long entries when price is more than 4% above the 50-day moving average — a simple overextension circuit breaker.
- Start with reduced sizing (0.5% risk per trade) for the first ten trades, then scale to full 1% sizing once the live equity curve matches the backtested expectation within a reasonable tolerance.
The S&P 500 sitting one good session away from a fresh all-time high is not a moment for guesswork. The setup, the levels, and the risk parameters are all measurable — and a properly configured bot is the cleanest way to act on them without letting emotion drive the trade. For help selecting and tuning the right system for your account size and trading style, get in touch with our team and we'll walk you through the configuration step by step.