USD/JPY at 157.50: A Yen Caught Between BOJ Intervention and a Stretched Dollar
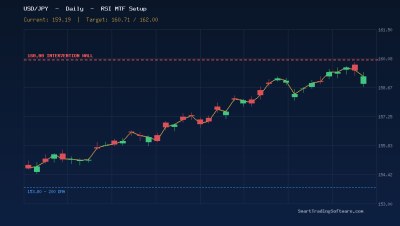
USD/JPY has spent the opening days of May 2026 under heavy two-way pressure, with spot now trading around 157.50 after one of the most aggressive Bank of Japan interventions in over a year. The pair had spent most of late March and April consolidating just below the psychologically critical 160.00 handle, repeatedly probing the 160.46 swing high before sellers stepped in on every test. The 200-day moving average sits well below current price at 153.80, which underlines just how stretched the multi-month uptrend has become.
The trigger for the latest leg lower was a fast-moving intervention round that drove the pair more than 400 pips in a single morning session, briefly tagging 155.50 before USD demand reasserted itself. Price has since stabilised in a wide 157.48 - 160.46 range, and the daily MACD remains in negative territory near the zero line - exactly the kind of indecisive structure where momentum-based oscillators tend to outperform pure trend-following systems.
Why a CCI Strategy Fits the Current USD/JPY Range
The Commodity Channel Index, originally designed by Donald Lambert for commodity markets, is built to flag when price is statistically far from its moving average. In a clean trending environment, CCI extremes can be misleading, but inside a wide consolidation like the current 157.48 - 160.46 band, CCI readings above +100 and below -100 line up unusually well with the upper and lower edges of the range. With the BOJ openly defending the 160 zone and dollar bulls defending the 157 area, the pair has effectively become a mean-reverting instrument until one side breaks.
For traders who do not want to babysit screens around Tokyo and London opens, the CCI Bot automates this exact playbook on MT4 and MT5. It evaluates every closed candle, fires only when CCI crosses defined thresholds, and applies the same stop-loss and take-profit logic on every signal - removing the discretionary noise that usually plagues range trading.
Bearish entry near range resistance
Wait for price to push back into the 159.20 - 159.80 zone on H1 or H4 and look for CCI(20) to cross back below +100 from overbought territory. A confirmed bearish cross while price prints a rejection candle inside that supply pocket is a classic short trigger.
Suggested risk plan: stop-loss 30 - 40 pips above the recent swing high near 160.10, first take-profit at 158.20 (mid-range), second take-profit at 157.48 (range floor), and a runner toward 155.37 if the BOJ intervention zone gives way. That delivers a comfortable 1:2 to 1:3 risk-reward without forcing the trade.
Bullish entry near range support
Symmetrically, when price slides into 157.50 - 157.20 and CCI(20) crosses back above -100 from oversold, look for a long with a stop below 157.00 and targets at 158.50 and 159.40. The stop sits just under a level the BOJ has effectively defended, giving the structure a logical invalidation point.
How Automation Removes the Two Biggest USD/JPY Mistakes
Two errors burn most discretionary USD/JPY traders during intervention regimes: chasing breakouts that get faded within hours, and freezing during the violent reversal candles that follow BOJ activity. Automation solves both. A bot does not feel the FOMO of a 60-pip green candle, and it does not refuse to take the next valid signal just because the previous one stopped out.
Pairing the CCI Bot with the MA Distance Indicator gives an additional confluence filter - the indicator quantifies how far price has stretched from its moving average, so the bot can be configured to only fire CCI signals when price is statistically extended. That single filter removes a meaningful chunk of mid-range chop trades.
Before deploying any rule set live, every parameter should be validated on years of USD/JPY tick data. The Indicators Tester lets you replay the exact CCI thresholds, ATR-based stops, and trade-management logic against historical sessions, so the strategy that gets switched on in a live account has already been stress-tested through similar volatility regimes.
Key USD/JPY Levels to Watch This Week
Resistance to monitor on the upside: 158.20 mid-range pivot, 159.80 - 160.10 intervention zone, then the cycle high at 160.46. A clean H4 close above 160.50 would invalidate the range thesis and reopen the path toward 162.06.
Support to monitor on the downside: 157.48 immediate floor, the BOJ intervention low at 155.50 - 155.37, and below that, 153.80 where the 200-day moving average is converging with the next major weekly swing. A daily close below 155.30 would signal that the rising wedge that has guided price since February has finally completed, with measured-move targets pointing back toward the low-153s.
Getting Started With the CCI Bot on USD/JPY
- Download and install the CCI Bot on your MT4 or MT5 trading platform.
- Attach it to a USD/JPY H1 or H4 chart and set CCI period to 20 with thresholds at +100 and -100.
- Add the MA Distance Indicator as a confluence filter to skip mid-range signals.
- Backtest the configuration across the last 12 months on the Indicators Tester before going live.
- Start with reduced position size while the BOJ remains in active intervention mode and scale up only once the strategy has produced a clean live week.
If you would like our trading desk to help tune the CCI Bot to your account size and risk profile, reach out via the contact page and one of our analysts will walk you through the setup.