XAU/USD Sits at $4,545 as Gold Coils Beneath the $4,670 Pivot
Gold (XAU/USD) is grinding sideways near $4,545 per ounce in mid-May 2026, holding inside a tight consolidation that has frustrated both bulls and bears for most of the week. Spot gold ticked up about 0.10% on May 18 in low-volume trade, with the metal pinned between firm support around $4,540 and rolling moving-average resistance overhead. The 20-period SMA sits at $4,618.67, the 100-period SMA at $4,642.86, and the 200-period SMA at $4,695.82 — a stack that has effectively capped every intraday rally attempt this month.
The macro backdrop is what makes the current pause interesting. April CPI printed hotter than expected, which lifted the dollar index and 10-year yields and pushed traders to trim Fed rate-cut bets for the back half of 2026. Yet the bid has not disappeared: China's central bank has continued to add to its gold reserves, and ongoing geopolitical uncertainty keeps a structural floor under price. The result is the classic compression pattern that precedes a breakout — and the level traders are watching is $4,670.
The $4,545 → $4,670 Breakout Setup Explained
The trade idea is straightforward in concept and painful to execute by hand. Bulls need a clean daily close above the $4,651 minor pivot to neutralise the short-term Strong Sell tilt, then a sustained push through $4,670 to confirm a momentum breakout. The next obvious target on the upside is the $4,720 resistance, followed by the $4,750–$4,850 supply zone that has acted as a ceiling since the late-April reversal. A failure to reclaim $4,670 keeps gold trapped beneath the 20- and 100-period SMAs and reopens the door to a retest of $4,540, then $4,493 — the bottom of the broader April low-week close zone.
Entry Triggers
The clean trigger is a 4-hour candle close above $4,670 with rising volume. A more aggressive entry is a pullback into $4,651–$4,655 after the initial breakout, provided RSI on the H4 has not yet crossed back below 60. A breakout that gaps straight to $4,700 without a retest is usually a warning sign that the move is exhausted on the first push, so position size should be scaled down in that scenario.
Exit, Stop Loss and Take Profit
Initial stop loss belongs below the $4,618 SMA cluster, ideally on a 4-hour close at $4,615 or lower. Take-profit 1 sits at $4,720 (the first resistance shelf) for roughly a 1:1 reward-to-risk profile, and take-profit 2 at $4,820 inside the supply zone for a 2:1 RR. Trailing stops should be moved to break-even once price prints a 4-hour close above $4,700.
Why Automation Beats Discretionary Trading in This Range
Range-to-breakout setups on gold are notorious for two failure modes: traders either jump the gun on the third or fourth false breakout, or they doze through the actual one. The $4,545–$4,670 compression is exactly the kind of structure where an automated approach pays for itself, because the bot does not get fatigued waiting and does not panic when the first attempt fails. Our Gold Bot is built specifically for XAU/USD price action and handles confirmation logic, volatility-adjusted stops, and partial-close rules so the trader does not have to babysit the screen during the FOMC minutes release or the CPI follow-through.
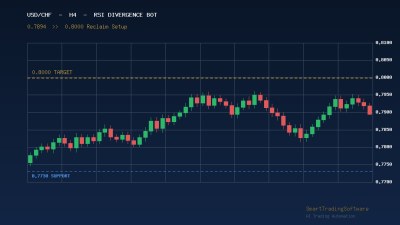
For multi-timeframe confirmation, the RSI Divergence Bot is a useful overlay on the H1 and H4 to spot momentum exhaustion before the bot fires its breakout entry. Combined with the MA Distance Indicator, you also get a clear read on whether price is stretched away from the 20/100/200 SMA cluster — which on gold typically signals a mean-reversion risk in the first 24 hours after a breakout.
Key Levels to Watch in the Coming Sessions
On the upside, the layered resistance map looks like this: $4,651 (minor pivot), $4,670 (the breakout trigger), $4,720 (first measured target), $4,750–$4,850 (supply zone), and $4,894 — the record high-week close from earlier this cycle. A monthly close above $4,894 would reopen the path toward $5,025, the 61.8% retracement of the January decline, and ultimately the $5,100 ceiling of the May projected range.
On the downside, $4,540 is the line in the sand for short-term bulls. A daily close below $4,540 invalidates the breakout thesis and likely drags price toward $4,493 and then the $4,380–$4,500 zone, where the yearly low-week close and the 61.8% retracement of the October rally converge. That is also the region where central-bank buying has historically reappeared, so any flush there should be treated as a setup to reload long rather than a continuation short.
Getting Started With the $4,670 Gold Breakout Plan
If you want to deploy this setup without manually watching every H4 close, the process is short:
- Install the Gold Bot on a MetaTrader 4 or 5 account that supports XAU/USD with a reasonable spread (under 35 cents during London/NY overlap).
- Configure the breakout trigger at $4,670 with a hard invalidation below $4,615. Set TP1 at $4,720 and TP2 at $4,820.
- Run the RSI Divergence Bot in monitor-only mode on the H1 to filter against entries that fire into a bearish divergence.
- Backtest the combined configuration on the last 90 days of gold data before risking live capital — this is critical because gold's average true range has expanded materially in 2026.
- Cap risk at 0.5% of account equity per trade until you have at least 20 closed trades from the setup on a live account.
Gold's tight coil under $4,670 will not last much longer — these compressions on XAU/USD usually resolve within 5 to 10 trading sessions. Whether the breakout finally clears the SMA cluster or fails into a deeper reset to $4,493, the right automation removes the discretionary noise from the trade. If you want help wiring this setup into your existing MetaTrader stack or sizing it against your account, get in touch with our team and we will walk you through the configuration.