Bitcoin Slides to $77,087 as Rising Wedge Breakdown Triggers Oversold RSI
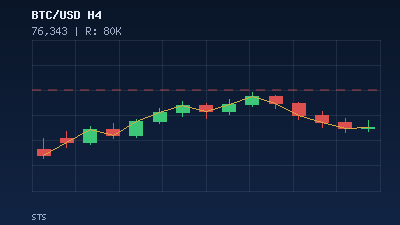
Bitcoin is trading at $77,087 on Tuesday, May 19, 2026, down roughly 1.17% over the past 24 hours, after a clean breakdown from the rising wedge that had defined price action through early May. The selloff has dragged BTC below every key short-term moving average, with the 5-day EMA now at $78,940, the 50-day at $80,086, and the 200-day at $80,517. All three are sloping lower and acting as overhead resistance, while the 14-day RSI has slipped to 35.2, edging into oversold territory for the first time since the spring correction began.
The driver behind the move is not purely technical. Spot Bitcoin ETFs printed roughly $1 billion in weekly outflows through May 17, with institutions trimming exposure as Federal Reserve rate-cut expectations get pushed deeper into the second half of the year. That repositioning has compressed price into a tight band between $76,500 and $78,600, where bulls and bears are now fighting over the next directional leg. For active traders, this is the kind of compression that historically resolves with sharp, fast moves, and that is exactly the environment where a disciplined, automated approach earns its keep.
The Mean-Reversion Setup: Trading the EMA Reclaim
The cleanest playbook here is a mean-reversion long targeting a reclaim of the 5-day EMA at $78,940, followed by a stretch toward the 50-day at $80,086 and the prior resistance shelf at $81,500. With RSI at 35 and price extended below its short-term average, the statistical edge favors a snapback rather than a continuation lower, provided support at $76,500 holds. A break of $76,500 invalidates the long thesis and opens the lower support cluster near $73,500, which is the level last tested during the early-April reset.
The challenge for discretionary traders is that mean-reversion entries in crypto rarely give you a clean signal candle. Price typically wicks the support, fakes a continuation, and only reverses once retail stops have been cleared. By the time a chart pattern is obvious on the daily, the easy entry is gone. That is precisely the kind of execution problem that algorithmic strategies are built to solve.
Entry, Stop-Loss, and Take-Profit Parameters
For traders running this setup manually or via automation, the parameters worth defining in advance are:
- Entry zone: $76,800 to $77,200, ideally on a bullish reversal pattern (hammer, bullish engulfing, or RSI hidden divergence on the 4-hour).
- Stop-loss: $76,300, just below the lower support edge to avoid wick-stop hunts.
- Take-profit 1: $78,940 (5-day EMA reclaim), scale out 40 percent of the position.
- Take-profit 2: $80,086 (50-day EMA), scale out another 40 percent.
- Runner: $81,500 prior resistance, with trailing stop on a 1-hour close back below the 50-day.
- Risk-reward: approximately 1:2.5 on the first scale and 1:3.7 on the second, comfortably above the 1:2 threshold most prop firms require.
Why Automation Outperforms Discretion in This Tape
Bitcoin moves around the clock. The exchanges never close, liquidity rotates between Asia, Europe, and the United States, and the largest single-candle moves of any given week routinely happen at 3 a.m. local time for whoever is asleep at the wheel. A trader sitting at a screen will, statistically, miss the cleanest entries simply because human attention is not built for 168-hour weeks.
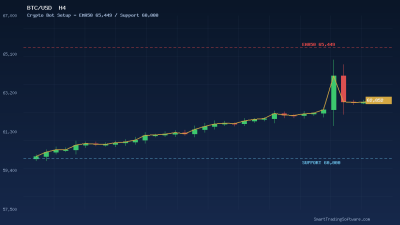
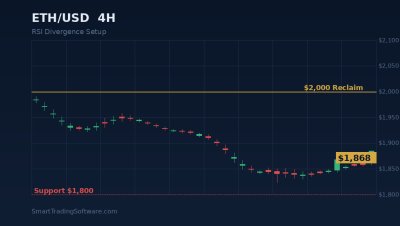
An automated execution layer fixes that. The Crypto Bot is designed for exactly this kind of multi-session, multi-condition crypto environment. It monitors price action against configurable EMA and RSI thresholds, waits for the confluence to align, and executes with pre-defined risk parameters, removing the emotional drag that turns a 1:3 setup into a 1:0.8 exit. For traders who prefer divergence-based entries rather than pure trend-following, the RSI Divergence Bot is purpose-built to flag the hidden and regular divergences that often precede reversals at oversold levels like the one Bitcoin is currently sitting at.
Before committing live capital, it is worth validating any strategy against historical data. The Indicators Tester lets you replay your EMA-and-RSI logic against months of past BTC price action to see how the rule set would have performed in similar oversold-bounce contexts, including the February consolidation and the late-March recovery. A strategy that does not hold up in backtest will not hold up live.
Key Levels to Watch This Week
The map for the next several sessions is straightforward. The bulls need to defend $76,500 and reclaim $77,700 on a 4-hour close to keep the bounce thesis intact. A push through $78,600 brings the 5-day EMA at $78,940 squarely into play, and a daily close above $80,086 would flip the short-term trend back to neutral-bullish. Above $81,500, the structure shifts and the prior $83,843 swing high becomes the next logical magnet.
On the downside, a clean break of $76,500 with sustained volume cancels the mean-reversion idea. The next meaningful support sits at $74,200, and a flush to the $73,500 cluster cannot be ruled out if ETF outflows accelerate. RSI dropping below 30 on the daily would be the confirmation signal for a deeper retracement, while a divergence between price making a lower low and RSI making a higher low would flag a bottom in the making.
How to Get Started
If you want to trade this setup with an automated edge rather than chasing wicks at 3 a.m., the steps are simple:
- Pick your execution tool. For Bitcoin and major altcoins, the Crypto Bot handles the EMA-and-RSI framework described above, and the RSI Divergence Bot covers the divergence-entry variant.
- Backtest the configuration. Run the Indicators Tester over the last six months of BTC data to verify the rule set survives in both the trending January leg and the choppy April reset.
- Forward-test on a demo account for at least two weeks before going live. Crypto volatility punishes ego, and a demo run will tell you whether your slippage and fill assumptions are realistic.
- Set position sizing so a full stop-out costs no more than 1 percent of account equity. Two losing trades should not impair your ability to take the third.
The current Bitcoin tape is not a moment to be undercapitalized or overexposed. It is, however, a setup with a defined invalidation, a clear oversold signal, and three layered take-profit targets, exactly the kind of structure that automated strategies are built to monetize. If you have questions about configuring any of the tools above for your account size, broker, or risk profile, our team is happy to walk you through it on the contact page.