Solana Reclaims $94 as Bulls Eye the $97.56 Wall
Solana (SOL) is changing hands near $94.33 in mid-May 2026, holding a tight base after a 9.3% advance over the last seven days and a 13.7% climb over the past month. Price is now coiling just under the descending trendline that has capped every attempt since early April, and the structure suggests that bulls are simply queuing up for the next test of the $97.56 resistance — the line that stands between Solana and the psychologically important $100 round number.
Momentum confirms the pressure. The 14-day RSI is sitting at 64.1, a neutral-to-bullish reading that leaves real room before any classical overbought signal triggers. More importantly, SOL is now trading above its 10, 20, 50 and 100-day EMAs — a clean short-term stack that historically precedes a continuation push. Only the 200-day EMA, parked at $111.64, remains as a longer-term ceiling, but that level is more relevant to swing traders than to anyone hunting the next breakout candle on the 4-hour chart.
The setup is textbook: a higher-low base ($87.16 swing), compressing range under a horizontal resistance ($97.56), and a momentum oscillator that is rising without being stretched. The question is no longer if SOL retests that resistance — it is when, and how a disciplined trader should be positioned to capture the move.
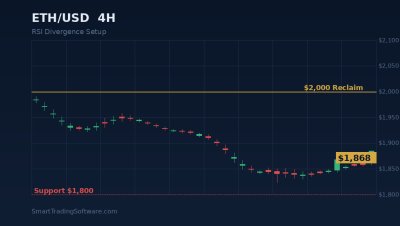
Trading the $97.56 Reclaim Setup with RSI Divergence Logic
The cleanest way to play this kind of compression is to combine a horizontal breakout filter with a momentum confirmation. A bullish RSI divergence above the mid-line (RSI > 50) — where price prints higher lows while RSI prints rising lows — has historically preceded most of SOL's strongest impulse legs. Even when the divergence is mild, the combination of structural support and rising momentum tends to flush out late shorts at the resistance flip.
Entry Conditions
The cleanest trigger is a 4-hour close above $97.56 accompanied by RSI(14) holding above 60 on the same close. Aggressive traders can scale in around $95.20–$95.80 on a confirmed RSI divergence — this front-runs the breakout but requires tighter risk management. For a more conservative bias, wait for the breakout candle to close above $97.56 and then enter on a shallow retest of that broken level.
Stop Loss
The natural invalidation sits below the most recent swing low. A 4-hour close under $92.40 would break the rising structure and the 50-day EMA simultaneously — that is the line in the sand for the bullish thesis. A wider, more swing-friendly stop sits below $87.16 in case price decides to retest the broader support zone first.
Take Profit Targets
The first logical target is the round number at $100.00, a level that has acted as both magnet and rejection point in 2026. A clean break above $100 opens the door to a measured-move objective near $104.50, and the more ambitious swing target sits at the 200-day EMA at $111.64. Sensible position management means scaling out a third at $100, another third at $104.50, and leaving the runner for the EMA reclaim.
Why a Bot Beats Manual Execution on This Setup
Crypto markets do not respect business hours. The $97.56 breakout could trigger at 3 a.m. local time on a thin Asian session candle, and by the time a manual trader reads the alert the entry is gone and the chase begins. Automation removes that latency entirely — the bot watches the close, validates the RSI condition, and fills the order before most traders even open their charts.
Our RSI Divergence Bot is purpose-built for exactly this scenario: it scans for hidden and regular RSI divergences across multiple timeframes and executes trades only when momentum confirmation lines up with a structural trigger. For traders who want a more general crypto execution layer, the Crypto Bot bundles trend, range and breakout logic into a single MT5-ready package with configurable risk parameters.
Before going live, every parameter should be validated on historical data. The Indicators Tester lets you backtest the exact RSI divergence rules described above against multiple years of SOL price action — so the entries, stops and targets you go live with are the ones that survived a real statistical filter, not just an optimistic eye-balling exercise.
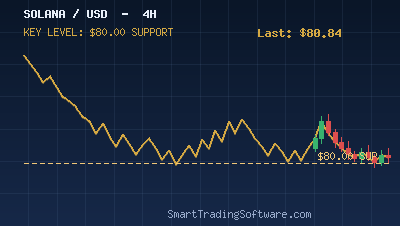
Key Levels to Watch on the SOL Chart
Three price zones define the next week of trade for Solana. The $97.56 resistance is the immediate decision point — a daily close above it is a confirmed breakout signal. The $100.00 round number is the first reaction zone above resistance and typically draws in profit-taking. On the downside, the $92.40 short-term support aligns with the 50-day EMA and protects the current bullish structure; a break below this level shifts the bias back to neutral and likely re-opens the $87.16 zone for retest.
Volume profile in the $94–$97 area is light, which is exactly the kind of low-resistance pocket that lets price travel fast once a breakout is confirmed. That is also why the entry timing matters: late chasers tend to enter inside the high-volume node above $100, where reactions are sharper and stops sit closer to entry.
How to Get Started with the RSI Divergence Setup
- Pick the execution layer. Download the RSI Divergence Bot if you want a specialized momentum tool, or the Crypto Bot for a broader crypto automation suite.
- Backtest the rules. Run the entry/exit logic on the Indicators Tester across at least two years of SOL data to validate win-rate and drawdown expectations on this specific pair.
- Configure the levels. Set the breakout filter at $97.56, the hard stop under $92.40, and partial-exit ladders at $100 / $104.50 / $111.64. Use a risk-per-trade of 1–2% of account equity.
- Deploy on demo first. Run the bot for 3–5 trading days on a demo account that mirrors your live broker's spread and execution latency. Only flip to live once you have observed at least one full setup cycle.
- Monitor — do not micromanage. Once the bot is live, intervene only if market structure changes (a major news event, a confirmed close below $87.16) rather than reacting to intraday wicks.
Solana's setup is one of the cleaner compression-to-breakout patterns to appear across the major crypto basket this month, and the RSI alignment makes it an attractive candidate for systematic execution. If you would like help configuring the parameters for your account size, broker, or risk profile, the SmartTradingSoftware team is one click away — get in touch via our contact page and we will walk you through deployment.