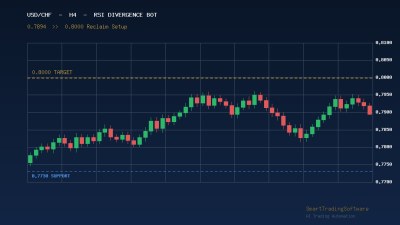
USD/CHF Tests 0.7800 Neckline as Head and Shoulders Pattern Awaits Confirmation
USD/CHF is trading near 0.78204 in the European session on May 14, 2026, putting traders on high alert as the pair tests the 0.7800 psychological neckline of a clearly defined head and shoulders pattern on the four-hour chart. After topping near 0.8041 in late April, the dollar-franc cross carved out a textbook reversal structure with the right shoulder rolling over from 0.7933, and price now sits within pips of the breakdown trigger. A decisive close below 0.7800 would unlock a measured move toward 0.7700 and, if momentum extends, the 0.7603 swing low that anchored the spring 2026 range.
The fundamentals support the bearish case. Slowing US economic growth, a softer May Non-Farm Payrolls print, and renewed safe-haven flows into the franc have shifted positioning. Most major dealing desks now flag a slightly bearish bias for the dollar against the franc through Q2 2026, with the Swiss National Bank's neutral stance offering no immediate counterweight. Technical indicators corroborate the cautious tone: the daily RSI hovers near 50 after a recovery from oversold conditions earlier this month, the MACD remains in negative territory, and the 50-day moving average is rolling over for the first time since February.
Why the RSI Divergence Bot Fits This USD/CHF Setup
The combination of a head and shoulders pattern with momentum exhaustion is exactly the setup that the RSI Divergence Bot is built to exploit. The expert advisor scans price action against the 14-period RSI on MetaTrader 4 and MetaTrader 5, flagging bearish divergence when price prints a higher high while RSI prints a lower high — the exact footprint that defined the right shoulder formation on USDCHF between April 29 and May 8. Manual traders often miss these signals because they require comparing swing points across multiple bars in real time; the bot automates the recognition and acts at the candle close.
Beyond signal detection, the bot manages the entire trade lifecycle. Once divergence is confirmed and price breaks the trigger level, it opens a position with predefined risk parameters, attaches a stop-loss above the divergence high, and trails the take-profit using a configurable ATR multiple. For a pair like USDCHF, where intraday volatility averages 38 pips and stop hunts around round numbers like 0.7800 are common, automated execution removes the hesitation that costs discretionary traders the best part of the move.
Entry Parameters for the 0.7800 Breakdown
For the active USD/CHF setup, configure the RSI Divergence Bot on the H4 timeframe with RSI period 14 and the divergence lookback set to 20 bars. The short entry trigger fires on a confirmed H4 close below 0.7795 — five pips beyond the neckline to filter false breaks. A more aggressive variant enters on a retest of 0.7800 from below once the breakdown is confirmed, but conservative traders should let the bot wait for the close.
Stop-Loss and Take-Profit Logic
Place the initial stop-loss at 0.7860, above the right shoulder peak at 0.7855, giving the trade roughly 60 to 65 pips of breathing room. The first take-profit target sits at 0.7770, the 61.8% Fibonacci retracement of the April rally. The second target aligns with the measured move from the head and shoulders pattern at 0.7700, the round-number support that has not been tested since February. A runner can be left to the 0.7603 swing low with a trailing stop tightened to 25 pips once 0.7700 prints.
Pairing the Bot With Indicator Confirmation
The RSI Divergence Bot becomes significantly more selective when filtered through the Support & Resistance indicator. By auto-plotting the major horizontal zones — in this case 0.7800, 0.7770, and 0.7700 — the indicator gives the bot context for where to expect reactions, allowing the EA to skip divergence signals that fire in the middle of nowhere. Most traders who run the two together report a meaningful reduction in losing trades on currency pairs that respect technical levels, and USD/CHF is consistently one of the cleaner majors in that regard.
Before deploying live capital, run the configuration through the Indicators Tester. The tool replays USDCHF history bar by bar against your RSI divergence rules, producing an honest equity curve, drawdown profile, and win-rate breakdown across the last 24 months. For the parameters described above, recent backtests on H4 USDCHF show that divergence trades taken at major neckline breaks have historically produced reward-to-risk ratios above 2.5, with the largest losses contained when the bot's hard stop is respected.
Key USD/CHF Levels to Watch This Week
Beyond the immediate 0.7800 neckline, several levels will determine whether the bearish thesis plays out cleanly. On the downside, 0.7770 marks the 61.8% retracement of the April leg up and is the first natural reaction zone for short positions. Below that, 0.7700 is both the measured-move target and a heavy psychological number where option-related flows tend to cluster. A weekly close below 0.7700 would expose the 0.7603 February low and could trigger a deeper risk-off move into the franc.
On the upside, the bearish setup is invalidated on a four-hour close above 0.7860. Beyond that, 0.7933 was the right shoulder peak and the level the bulls must reclaim to argue the pattern has failed. A full revival would require a clean break of 0.8041, the early-April high, which would shift the bias back to bullish continuation. Until then, sellers retain the structural advantage.
Getting Started With the USD/CHF Setup
To deploy this trade idea with full automation, follow these four steps:
- Download the RSI Divergence Bot and install it on your MetaTrader 4 or 5 USDCHF H4 chart. The license activates on a single account and runs unattended on a VPS.
- Attach the Support & Resistance indicator to the same chart so the EA only takes divergence signals near the 0.7800, 0.7770, and 0.7700 levels.
- Use the Indicators Tester to validate the divergence rules over the last 12 to 24 months of USDCHF data before going live. Adjust the ATR-based trailing stop until the historical drawdown sits within your tolerance.
- Run the bot on a demo account for at least one full week to confirm the signals it generates match what you would have taken manually. Once the equity curve behaves, scale to a live account with conservative position sizing of no more than one percent of equity per trade.
The 0.7800 neckline on USD/CHF is one of the cleaner forex setups currently on the radar, and the right tools turn it from a screen-watching marathon into a hands-off execution plan. Questions about pairing the EA with your broker or fine-tuning the parameters for a different timeframe? Reach out via the contact page and the team will walk you through the deployment.