GBP/USD Stalls at 1.3480 as Cable Tests Major Trend Line Resistance
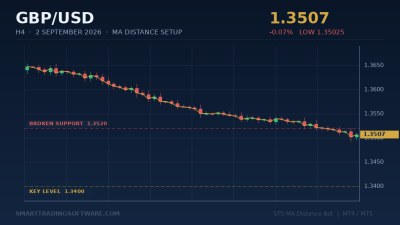
The British pound is grinding higher against the US dollar this week, with GBP/USD trading around 1.3480 on May 26, 2026. Cable has spent the past two weeks rebuilding from the 1.3300 swing low, and the pair now sits just below a downward-sloping resistance trend line that has capped every meaningful rally since the 1.3867 high earlier this year. Price is hugging the 8-, 21-, 50- and 100-day exponential moving averages in a tight cluster, which historically precedes an expansion in volatility.
The technical picture is best described as a compression coil. May 22's low at 1.3413 is the immediate support shelf, with a deeper pivot at the May 20 print of 1.3375. To the upside, the falling trend line projects through 1.3612, and a clean daily close above that line opens the door to a retest of 1.3657 and the broader rally extension toward 1.3700. The pattern is textbook for a support-and-resistance breakout strategy, which is why we are highlighting it as this week's actionable Forex setup.
Trading the GBP/USD Compression Coil
The plan we are running is simple in description but demanding to execute manually. We want to fade weakness inside the range, then flip aggressive on a confirmed break of the descending trend line near 1.3612. Both the long-side accumulation inside the channel and the breakout extension are best handled by a rules-based engine that does not blink when price stalls at moving-average resistance.
Entry Triggers
Long bias entry: a 1-hour or 4-hour close above 1.3612 with rising volume on the bar of the break. A second confirmation entry can be taken on the first pullback to the broken trend line that holds above 1.3580. Inside the range, a reactive long at 1.3413 is acceptable only when the stochastic on the 1-hour is below 20 and turning up.
Stop Loss Placement
For the breakout entry, place the protective stop at 1.3565 — below the broken trend line and the 21-day EMA cluster. For the range long at 1.3413, the stop sits at 1.3375 just under the May 20 swing low. Both stops respect ATR and avoid the typical liquidity sweep zone above and below round numbers.
Take Profit Targets
First profit objective on the breakout setup is 1.3657, the prior swing high. Second target sits at 1.3700, with a runner toward 1.3867 if the wider rally from 1.3158 resumes. For the range trade, the first scale-out is at 1.3540 and the full exit at 1.3612.
Why Automation Beats Manual Execution on This Setup
Trend line breakouts on cable are notorious for producing fake-outs during the London-to-New York handover. Many traders see the break, hesitate for confirmation, and then chase 30–40 pips above the entry — turning a clean 1:3 trade into a 1:1. A properly configured Expert Advisor sees the same break in milliseconds, applies the volume filter, and enters at the exact price defined by the rules.
Our Support Resistance Bot is built around exactly this kind of structural trading. It auto-detects the most recent horizontal pivots and the slope of the prevailing trend line, then arms breakout orders bracketed by configurable stop-loss and take-profit logic. Combined with the Trend Lines Bot, which follows EMA stacks for trend confirmation, you get a two-layer system that filters out the chop the cable is famous for.
For traders who want to validate the rules before risking real capital, the Indicators Tester lets you replay the last six months of GBP/USD price action bar by bar against the same trend line and support/resistance algorithm the live bot uses.
Key Levels to Watch This Week
The cable map for the next five sessions is unusually clean. Bulls need to defend 1.3413 on any pullback; a daily close below that level voids the breakout thesis and opens 1.3375 then 1.3300 as the next pivots. Bears need a sustained move below 1.3375 to argue that the corrective pattern from 1.3867 has not yet exhausted itself.
To the topside, 1.3612 is the line in the sand. A weak break that fails to hold by the next London close is a signal to stand aside — most genuine breakouts on GBP/USD confirm within four hours and do not revisit the broken level on the same session. A confirmed break unlocks 1.3657, then 1.3700, with the medium-term roadmap pointing to 1.3867 and eventually the 1.4248 cycle resistance from 2021.
Macro context favors the bullish scenario. The dollar index is sitting on its own short-term support after a soft run of US data, and UK rate expectations have firmed marginally over the past week. Neither factor is dominant, which is exactly why a structural breakout strategy outperforms directional bias trading right now.
Getting Started With the Cable Breakout Setup
If you want to deploy this setup on your own MT4 or MT5 terminal, the workflow is straightforward:
- Download and install the Support Resistance Bot for MetaTrader. Attach it to a 1-hour GBP/USD chart and load the default S/R preset.
- Set the pivot lookback to 60 bars and the breakout confirmation candle count to one. Keep the trade size at 0.5 percent of equity per signal while you verify behaviour.
- Layer the Trend Lines Bot on the 4-hour chart of the same instrument so that long signals only fire when both engines agree. This drops the false-signal rate noticeably during low-volatility weeks.
- Use the Indicators Tester to backtest the combined ruleset over March, April, and May 2026 data. Adjust the SL distance only if the historical drawdown exceeds your comfort threshold.
- Switch to live mode with a small position size after at least 48 hours of demo monitoring during active sessions.
The next 1.3612 test on GBP/USD will arrive on its own schedule, but the levels are mapped out and the rules are clear. If you would like a hand fine-tuning the bot parameters for your broker's spread profile or want a walk-through of the backtesting workflow, our team is one click away at the contact page.