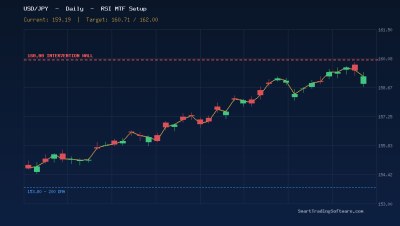
USD/JPY at 157.52: Range-Bound Setup Tested by BOJ Intervention Risk
USD/JPY is trading near 157.52 in mid-May 2026 after a turbulent stretch defined by suspected Bank of Japan intervention. The pair has been compressed inside a 157.59–160.46 consolidation range since mid-March, and recent action has produced a sharp 450-pip drop from the 162 zone after Tokyo authorities reportedly stepped in around the 156 area. According to currency market reporting, suspected BOJ operations starting April 30 have totaled roughly 10 trillion yen, equivalent to over $63 billion, and Japan's top currency diplomat has stated there is no limit to how often officials can act.
For traders running automated strategies on MetaTrader 4 or 5, this is a textbook range-with-event-risk environment. Price is grinding within a tight band, momentum oscillators keep flipping, and the dominant tail risk is a sudden gap on intervention headlines. That combination tends to punish trend-following systems and reward mean-reversion logic anchored to clearly defined support and resistance levels — provided the bot includes proper stop placement to survive a single overnight wick.
Building a Range Strategy Around 155.37 Support and 158.55 Resistance
The current technical map gives automation a clean structure to work with. The lower edge of the range sits at 154.79–155.39, and the broader rising wedge that has dominated the chart since spring projects a measured-move target at 155.37. To the upside, 158.55 is the key intraday resistance, with 160.22 and 160.47 acting as the upper rail of the consolidation. Above 160.47, momentum buyers can target 162.06, but until that breakout prints, the highest-probability setup remains buying the lower band and selling the upper band.
The Support Resistance Bot is built precisely for this kind of structure. It identifies fresh swing pivots on the higher timeframe, then waits for price to react at those zones on a lower timeframe before opening a position — which avoids the common range-trader mistake of entering the moment price tags a level. In USD/JPY's current state, the bot would treat 155.40 as the long zone and 158.55 as the short zone, with confirmation candles required before triggering.
Suggested Parameters for the Current Range
Based on the May 2026 structure, sensible defaults would look like this. Long entries: 155.40–155.60 with a confirmation bullish engulfing or pin bar on the H1. Stop loss below 154.70, just under the wedge floor and beneath the suspected intervention zone. First take-profit at 156.90 (mid-range), second at 158.30 just under resistance. Short entries: 158.45–158.55 on bearish rejection with stop loss above 159.10. First TP at 156.90, second at 155.50.
Position Sizing With Intervention Risk in Mind
Because BOJ intervention can move USD/JPY 200 pips in minutes, risk per trade should be cut to roughly half of what a trader would normally allocate to a major pair. A 0.5% risk-per-trade setting, rather than the more typical 1%, keeps drawdowns contained if a stop is gapped through. The bot's news-filter setting should also be enabled to pause new entries during scheduled BOJ communications and US CPI prints.
Why Automation Helps in a Choppy, Headline-Driven Pair
Range trading sounds simple on paper, but USD/JPY in 2026 has been anything but mechanical. The pair grinds for sessions, then dumps 100 pips on a single Reuters headline, then grinds again. Manual traders end up either chasing the move late or freezing during the actual setup. An automated system removes that hesitation entirely — it acts on the levels regardless of whether the trader is at the screen, and it sizes positions consistently across trades.
Pairing the S&R bot with the MA Distance Indicator adds a second layer of confluence. The indicator flags when price has stretched too far from its moving average, which in a range tends to coincide with reversals back toward the mean. When MA distance hits an extreme reading at the same time price arrives at 155.40 or 158.55, the probability of a clean bounce climbs meaningfully. Many users run the indicator on the 4-hour chart while letting the bot operate on the 1-hour for entries.
Before deploying live, every parameter set should be validated on historical data. The Indicators Tester lets traders replay the past 6–12 months of USD/JPY tick data and measure how the chosen support and resistance levels would have performed, including through prior intervention episodes. That historical stress test is what separates a strategy that looks good in theory from one that survives a real BOJ surprise.
Key Levels to Watch This Week
The lines drawn on the USD/JPY chart right now are unusually well-defined, and they should be the entire focus of any automated setup. Immediate resistance is 157.70, then 158.55 as the key intraday cap. A daily close above 158.55 opens the door to a retest of 160.22–160.47, the upper rail of the multi-month range. Above 160.47, the next meaningful zone is 162.06 followed by 164.21.
To the downside, 157.48 is the first soft support, then 155.37–154.79 is the critical zone — this is where the rising wedge target sits and where prior intervention reportedly took place. A break below 154.70 on a daily close would invalidate the range thesis and shift the bias toward 153.61, then 152.07. Until either edge breaks, the highest-probability path is more sideways action with sharp two-way moves on headlines.
Getting Started With the USD/JPY Range Setup
Putting the strategy into practice on MetaTrader takes only a few steps:
- Install the Support Resistance Bot on your MT4 or MT5 USD/JPY chart and configure the H4 timeframe for level detection with H1 for entry confirmation.
- Add the MA Distance Indicator on a separate H4 chart as a confluence filter and set alerts for extreme readings near 155.40 and 158.55.
- Backtest the configuration against the last 12 months of USD/JPY data using the Indicators Tester, paying close attention to how the system handled the late-April intervention candles.
- Reduce risk-per-trade to 0.5%, enable the news filter for BOJ statements and US CPI, and start with a small live position size to validate execution on your broker.
- Review trade results weekly and re-evaluate the 155.40 and 158.55 levels every Sunday in case the consolidation range has shifted.
For setup help, custom parameter tuning, or volume licensing across multiple accounts, reach out via our contact page — the team can review your current MT4/MT5 configuration and recommend adjustments tailored to your broker, capital base, and risk profile.