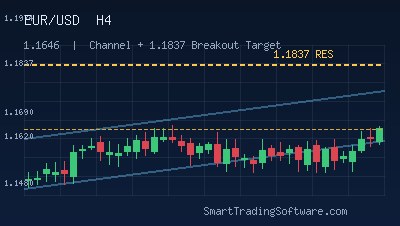
EUR/USD Stalls at 1.1746 Resistance: Bearish Divergence Brewing
EUR/USD enters May 2026 consolidating near 1.1746, a critical resistance zone defined by the 2026 yearly open, the 2025 high-week close, and the 2025 high-close. After the European Central Bank's recent rate decision, the euro pushed higher but the advance has now faltered at this pivotal zone for a fourth consecutive week. Momentum oscillators are starting to roll over while price prints higher highs, a classic setup for traders watching for bearish RSI divergence ahead of a potential pullback toward 1.1598 key support.
The Fed and ECB policy divergence continues to shape the medium-term outlook, with Fed cuts meeting an ECB hold. While moving averages from MA5 to MA200 still show a Strong Buy bias, the inability to clear 1.1746/75 on a weekly closing basis points to fading topside conviction. This is exactly the environment in which a disciplined divergence-based system shines — fading exhaustion at confluence resistance with a tight invalidation level.
Trading the EUR/USD RSI Divergence Setup
The current EUR/USD chart structure offers a textbook short-bias divergence trade. Price is testing 1.1746 resistance for the fourth time, but each successive push higher is being met with weaker RSI readings on the H4 and daily timeframes. When this pattern resolves, the path of least resistance typically points back toward the 50-day EMA and the 1.1639 minor support before extending toward the 1.1578/98 key support pocket.
Traders running the RSI Divergence Bot can let the algorithm scan for the exact bearish divergence pattern as the indicator confirms the lower high while price prints the higher high. Once the divergence is locked in, the bot manages the trade end-to-end without subjective overrides — no second-guessing whether the divergence is "good enough" to act on.
Entry Parameters
Wait for confirmed bearish RSI divergence on the H4 between any high in the 1.1730–1.1775 zone and the prior swing high. Entry triggers on the close of the H4 candle that fails to make a new RSI high while price tags the resistance band. Position sizing should respect 0.5% to 1% risk per trade given the broader Strong Buy regime.
Stop Loss and Take Profit
Place the protective stop just above the 1.1780 swing reaction high, giving the trade enough room to handle a typical fakeout above 1.1746. The first take-profit target is 1.1639, which aligns with the rising 50-day EMA and prior consolidation support. The runner target is 1.1598, the upper edge of the 1.1578/98 key support zone, where buyers historically defend the broader range. Using a partial close at TP1 and trailing the remainder is a sensible approach.
Why an Automated Approach Helps Here
Manual divergence trades are notoriously hard to execute. By the time a human spots the pattern, confirms it, and double-checks the news calendar, the entry is often gone — or worse, the trader chases a level that is no longer valid. This is even more painful in a consolidating pair like EUR/USD where each rejection sequence can play out in just a few hours of London or New York trade.
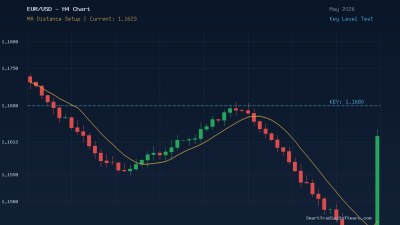
Pairing the RSI Divergence Bot with the MA Distance Indicator adds a second filter: the bot can be configured to only fire shorts when price is stretched a defined number of pips above the 50 EMA, which is exactly the condition that exists right now near 1.1746. Before going live, traders should always validate any tweaks on the Indicators Tester using EUR/USD H4 history from the past 12 months — that covers the entire consolidation regime since June.
Key Levels to Watch in May
The 1.1746/75 resistance band is the line in the sand for bears. A clean weekly close above this region, especially with momentum confirmation, would invalidate the divergence thesis and expose the next leg toward 1.1917 (100% extension of the 2022 advance and the 2025 swing high) and the 1.2020 38.2% retracement of the broader 2008 decline. On the downside, 1.1639 is the first checkpoint, followed by 1.1578/98 as the major demand zone that has held since mid-2025.
If 1.1578 gives way, the structure shifts materially and 1.1355/94 becomes the next reasonable downside magnet. That scenario likely requires either a hawkish surprise from the Fed or a dovish ECB pivot, neither of which is the base case for May. For now, range-trading the 1.1578–1.1746 zone with divergence triggers remains the highest-probability playbook.
Getting Started With This Setup
- Install the RSI Divergence Bot on your MetaTrader 4 or MetaTrader 5 account.
- Attach the bot to the EUR/USD H4 chart and configure the divergence-confirmation lookback to capture the multi-week resistance test.
- Add the MA Distance Indicator as a confluence filter for stretched-from-EMA shorts.
- Run a 12-month backtest on the Indicators Tester to validate the parameters across the current consolidation regime.
- Start with a demo or micro-lot live account to confirm execution behavior before scaling position size.
Need help fine-tuning the RSI Divergence Bot for your broker, your spread, or a specific risk profile on EUR/USD? Reach out via the SmartTradingSoftware contact page — our team can walk you through the optimal settings for the current 1.1578–1.1746 range.