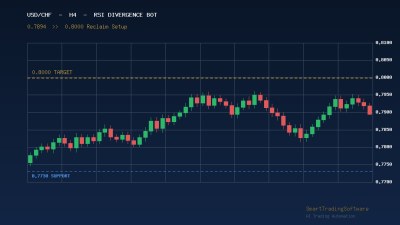
USD/CHF Slips to 0.7845 as Swiss Franc Strength Pressures the Dollar
USD/CHF has spent the final week of April 2026 trading inside a tight, downward-sloping range, with spot recently changing hands near 0.7845. The pair entered the week with a clearly bearish daily structure, a sequence of lower highs from the 0.8070 swing top, and a Bollinger middle band that continues to cap rallies on both the H4 and D1 timeframes. The Swiss franc has remained one of the strongest G10 currencies through April, supported by safe-haven flows and persistent dollar softness across the majors.
The technical picture lines up with that bias. Immediate support sits in the 0.78450 - 0.78475 zone, the same area defended on intraday pullbacks last week. Below it, the major D1 swing low cluster at 0.77750 - 0.77850 is the obvious magnet for sellers, with deeper monthly support at 0.7690 and 0.7535 if momentum extends. To the upside, sellers have repeatedly stepped in at 0.78730 - 0.78760, a confluence of recent H4 swing highs and the descending trendline drawn from the early-April peak. A clean break above 0.78820 - the secondary resistance and H4 Bollinger upper band - would be the first sign that the bearish leg is losing steam.
What makes this setup interesting is the divergence developing on the lower timeframes. While price has carved out lower lows on the H1 and H4 charts, RSI on those same timeframes has printed shallower troughs each time. That slow loss of bearish momentum is exactly the kind of structure that tends to precede either a deep corrective bounce into resistance or a final exhaustion push to the major support before reversal. Either path can be traded mechanically - if the rules are clear and the execution is disciplined.
The Strategy: Trading USD/CHF with an RSI Divergence Bot
Manually catching divergences in real time on a fast-moving forex pair is brutal. By the time a trader confirms the divergence, draws the trendline, and waits for a candle close, the high-probability entry is often already gone. This is where automation earns its keep. An RSI divergence bot evaluates every closed candle on a chosen timeframe, compares price pivots with RSI pivots, and only signals a trade when both conditions are confirmed by code - no second-guessing, no "this one looks close enough."
For the current USD/CHF setup, the playbook is symmetrical and rule-based:
Bearish continuation entry near resistance
Wait for price to grind back into the 0.78730 - 0.78760 resistance band on H1 or H4. Look for a regular bearish RSI divergence (higher high in price, lower high in RSI) confirmed on candle close. Enter short on the trigger candle, place the stop above 0.78820 (just outside the secondary resistance), and target the 0.7820 intraday level first, then the major 0.77750 - 0.77850 zone for the runner. This is roughly a 1:2.5 to 1:3 risk-to-reward play if executed at the band.
Bullish reversal entry at major support
If price slides directly into the 0.77750 - 0.77850 support without first revisiting resistance, the bot watches for a regular bullish RSI divergence (lower low in price, higher low in RSI) on H1. A confirmed trigger flips the bias to long, with the stop tucked below 0.7770 and a first target back at the broken 0.78450 support-turned-resistance, and a second target into the 0.7873 zone if momentum holds.
Risk management parameters
Default risk per trade should sit between 0.5% and 1% of equity, with the stop distance dictating position size rather than the other way around. The bot can be configured to skip new signals during high-impact USD or CHF news prints (CPI, SNB-related headlines, NFP), which is non-negotiable on a pair that often moves 60-80 pips on a single release.
Why Automation Beats Manual Trading on This Setup
Two specific things make the USD/CHF April range a prime candidate for an automated approach. First, the actionable windows are short - the pair has been printing reversal candles around the resistance band within hours of touching it. Second, the divergence rules require precise pivot detection, which is the kind of pattern recognition that humans get wrong about a third of the time when they are tired, distracted, or biased.
The RSI Divergence Bot handles both problems by design. It scans for confirmed divergences on every closed candle, executes the entry inside the spread tolerance you define, and manages the trade with bracket orders the moment it is filled. Traders who prefer to see the divergence pattern visually first - or want to backtest variations of the rule before deploying capital - can pair it with the Indicators Tester to validate the strategy on historical USD/CHF data across multiple timeframes.
For traders who want a second confirmation layer at the support and resistance bands themselves, the Support and Resistance Indicator auto-plots the same horizontal levels discussed above and updates them as new pivots form. Stacking a level-based filter on top of the divergence rule typically removes a meaningful chunk of false signals, which matters more than any single winner on a pair that is still inside a broader compression.
Key USD/CHF Levels to Watch This Week
Bears need a daily close below 0.78450 to keep the trend intact and unlock the path toward 0.77750 - 0.77850. Until that breaks, the pair is technically still inside a corrective range and intraday two-way risk is the base case. Bulls need a sustained move above 0.78820 to argue that the bearish daily structure is changing, with 0.7903 and the 0.7945 area as the next upside checkpoints.
The high-fragility window means a single catalyst - a hot Swiss CPI print, an unexpectedly hawkish FOMC tone, or a sudden risk-off shock - can flip the order book in either direction. That is precisely why the rules-based approach matters more this week than usual: the trader who has the bot running and the levels pre-marked does not have to guess which way the news will land.
How to Get Started
- Pull a fresh USD/CHF H1 and H4 chart in MetaTrader 4 or 5 and mark the 0.78450, 0.78730, 0.78820, and 0.77750 levels manually so you can sanity-check the bot's signals.
- Install the RSI Divergence Bot on a demo account first and run it on the H1 timeframe for at least 48 hours of live data.
- Backtest the chosen settings against the last 12 months of USD/CHF price action with the Indicators Tester to verify the win rate and average R-multiple match expectations.
- Layer the Support and Resistance Indicator on the same chart so the bot's signals can be filtered through the auto-detected levels before each trade is taken.
- When the demo results look stable, move to a small live position - not the full target size - and monitor the first ten trades closely before scaling up.
USD/CHF at 0.7845 is one of the cleaner technical setups in the FX majors right now, but it is also one of the easier ones to over-trade if you stare at the screen waiting for a divergence to appear. Let the rules do the watching for you. If you want help configuring any of the tools mentioned above for your specific account size and broker, please get in touch with our team - we routinely walk traders through the first week of live deployment.