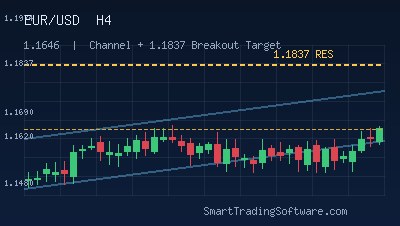
EUR/USD Defends 1.1685 Support as Bulls Set Sights on 1.1780 Breakout
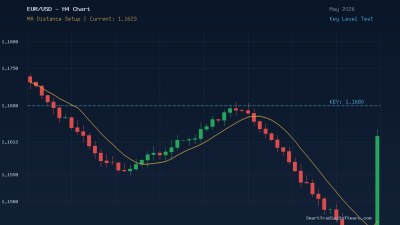
The euro is putting up a quiet but stubborn fight against the US dollar this week. As of late April 2026, EUR/USD is trading around 1.1685, hovering just above the cluster where the 50- and 200-period moving averages have converged near 1.1678. That confluence is acting like a magnet — buyers keep stepping in to defend the 1.1680–1.1690 support shelf, while sellers refuse to let price escape upward without a fight at 1.1780. With the Federal Reserve still leaning toward additional cuts and the European Central Bank in a wait-and-see mode, the macro backdrop favors a higher euro, but the chart needs a clean technical trigger before it commits.
Daily momentum is constructive without being euphoric. The RSI sits in the high 50s, far enough from overbought to leave room for upside, and the MACD histogram is gradually turning positive on the H4. Volatility has also compressed: the 14-day ATR has narrowed to roughly 65 pips, which historically precedes directional expansion. For traders watching support and resistance, that compression is the signal — when 1.1685 holds and 1.1780 finally cracks, the move is unlikely to be a slow grind.
The Setup: Trading the 1.1685–1.1780 Range with a Breakout Trigger
The cleanest way to play this structure is to treat 1.1685 as the floor and 1.1780 as the ceiling, then position for both a defended-support bounce and a confirmed breakout. The setup respects the broader bullish bias without forcing a trade in the middle of the range. A daily close above 1.1780 opens the path to the 1.1870–1.2000 resistance cluster that has capped EUR/USD for most of the cycle. Conversely, a daily close below 1.1625 would invalidate the bullish lean and shift focus to 1.1500.
What makes this setup attractive is that both edges of the range are mechanically defined — exact pip distances, exact invalidation levels, and exact reward targets. That is the kind of price action a rules-based trader can codify and let an algorithm handle, rather than sitting in front of the screen waiting for the candle to close.
Entry Parameters
Two entries can be staged in parallel. The first is a long at 1.1690–1.1700 on a confirmed reaction off the 1.1685 support — ideally accompanied by a bullish engulfing or pin bar on the H1 chart. The second is a breakout long on a 4-hour candle close above 1.1780, entering on the open of the next candle. Both entries piggyback on the same higher-timeframe bullish structure but with very different invalidation logic.
Stop Loss Placement
For the support bounce, place the stop at 1.1620, just below the secondary support at 1.1625. That is roughly 70–80 pips of risk, which is realistic given the recent ATR. For the breakout entry, the stop sits below 1.1745 — under the consolidation high that should now act as new support after the breakout. Tightening either stop further is tempting in a low-volatility regime, but it usually leads to being stopped on a routine wick.
Take Profit Targets
The first target for both entries is 1.1780, the upper boundary of the current range. That alone provides a healthy reward-to-risk on the support bounce. The second target is 1.1870, the lower edge of the major resistance cluster, where partial profits make sense. The runner can stretch toward 1.2000 if the daily candle closes above 1.1870 with momentum confirmation.
Why Automation Beats Watching the Tape
Range-and-breakout setups are the textbook scenario where automation outperforms manual trading. The trader needs to monitor two distinct trigger zones, keep a stop-loss and take-profit ladder honest, and act the moment a 4-hour candle closes — often during overnight sessions when discretion is at its weakest. An execution bot does not get bored at the third retest, does not move stops out of fear, and does not hesitate when 1.1780 finally prints.
The Support & Resistance Bot is built precisely for setups like this one. It accepts user-defined S/R zones, manages bracket orders around them, and switches between mean-reversion and breakout logic based on candle close confirmation. That means you can encode the 1.1685 / 1.1780 levels once and let the bot handle both sides of the range without second-guessing.
For traders who prefer to validate the price-action signal first, the Support & Resistance Indicator automatically maps multi-timeframe S/R zones directly on the MT4/MT5 chart, saving hours of manual line drawing each week. And before risking any capital on the live setup, every parameter — stop distance, breakout filter, target ladder — should be stress-tested against 12–24 months of historical data using the Indicators Tester to confirm the edge actually holds across different volatility regimes.
Key Levels Worth Watching This Week
The technical picture distills to a small handful of levels that will dictate the next leg. To the upside, 1.1780 is the immediate resistance and 1.1870 is the gate to the 1.2000 round-number magnet. The latter has rejected EUR/USD multiple times since the start of 2026 and remains the most important psychological barrier on the daily chart. To the downside, 1.1685 is the immediate support, 1.1625 is the secondary support that aligns with the 100-day EMA, and 1.1500 is the line in the sand for the bullish thesis.
Beyond pure price levels, two macro inputs deserve attention. First, the next round of Eurozone inflation prints will determine whether the ECB stays patient or signals fresh easing. Second, any softening in US labor data will reinforce Fed cut expectations and keep the dollar on the back foot. Either catalyst can fuel the 1.1780 break that the chart is already setting up technically.
Getting Started With This Setup
For traders who want to put this plan to work without staring at the chart all day, the workflow is straightforward.
- Add the Support & Resistance Indicator to your MT4 or MT5 chart and confirm that the 1.1685 and 1.1780 zones are flagged on the H4 and daily timeframes.
- Backtest the entry, stop, and target parameters on at least 18 months of EUR/USD history with the Indicators Tester. Look for a win rate above 45% and an average reward-to-risk above 1.6 before going live.
- Deploy the Support & Resistance Bot on a demo account with the validated parameters and let it run through at least one full week of price action.
- Promote to a live account with conservative position sizing — risking no more than 1% of equity per trade until the bot has logged 30+ live executions.
EUR/USD rarely hands traders a setup this clean. The compressed range, the aligned moving averages, and the supportive macro tailwind all point toward an eventual resolution higher — but only if 1.1685 keeps doing its job. If you want help configuring the Support & Resistance Bot for your account size and risk profile, reach out via our contact page and the team will walk you through the parameters before the next 4-hour candle even closes.