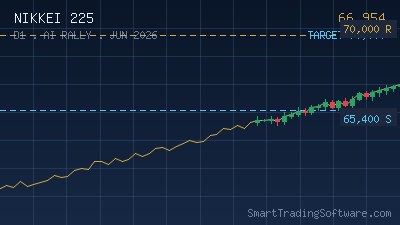
Nikkei 225 Holds Key Support at 53,370 as Japanese Equities Lead Global Rally
The Nikkei 225 has emerged as one of 2026's most compelling equity stories, climbing roughly 7.9% year-to-date and outpacing the major US benchmarks despite ongoing concerns over rising Japanese Government Bond yields. As of early May 2026, the index is trading near 54,000 with bullish acceleration intact above the critical 53,370 pivot, a level traders are watching closely for confirmation of the next leg higher.
Moving average studies across the MA5 through MA200 timeframes are flashing a Strong Buy reading, with 10 buy signals against just 2 sell signals on the daily chart. The RSI sits at 59.4 — firmly bullish but not overextended — leaving room for the index to push toward the 54,565 to 55,623 resistance band before any meaningful pullback. Improving domestic macro conditions, stable corporate earnings, and a still-supportive yen have combined to make Tokyo the standout performer among developed-market equities.
Trading the 53,370 Support Hold for a Move Toward 55,623
The setup here is textbook trend continuation. As long as the Nikkei 225 closes above 53,370, the structure of higher highs and higher lows remains intact and the path of least resistance points up toward the 55,000 psychological level and the 55,623 measured-move target. A confirmed daily close below 53,370, however, would invalidate the bullish thesis and open the door to a deeper retracement toward 53,000 and possibly 52,500.
Entry Parameters
Long entries can be staged on a clean retest of the 53,370–53,500 zone with bullish price action confirmation, or on a breakout close above 54,565 if momentum carries the index higher without a dip. Aggressive traders may also consider scaling in on a four-hour bullish engulfing pattern near the current 54,000 area.
Stop Loss and Take Profit
A protective stop below 53,000 keeps risk well-defined and shields the position from a false-break scenario. The first take-profit target sits at 55,000, the second at 55,623, and a runner can be left toward the 56,000 measured-move extension. This produces a reward-to-risk ratio of roughly 2.5:1 from the 53,500 entry zone — comfortably inside disciplined risk management thresholds.
Why Automation Matters for Nikkei 225 Setups
Tokyo trading hours create a real challenge for traders based in Europe or the Americas. The most decisive moves often happen during the Asian session, when most Western traders are asleep. Manually monitoring the 53,370 pivot or the 55,623 breakout level around the clock is not realistic, and missing the entry by even a few hours can erase most of the trade's edge.
This is precisely where rules-based automation earns its keep. The Trend Lines Bot automates moving-average and trend-line based entries, executing trades the moment price interacts with predefined levels — making it well suited for a setup that hinges on the 53,370 support hold and a clean break of the 54,565–55,623 resistance band. Pair it with the MA Distance Indicator to filter out signals when price is overextended from the 50-period moving average, a common cause of failed breakouts during news-driven Tokyo sessions.
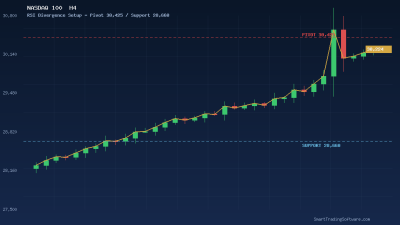
For traders who prefer a momentum-confirmation overlay, the RSI Divergence Bot can be layered alongside the trend bot to flag exhaustion at the 55,623 target and tighten exits before any reversal develops.
Key Levels to Watch on the Nikkei 225 This Week
The map for the days ahead is straightforward. Immediate support clusters at 53,500 and the pivotal 53,370 line, with secondary support at 53,000. On the upside, 54,565 marks the first meaningful resistance, followed by the round 55,000 figure and the primary objective at 55,623. A weekly close above 55,623 would unlock the next leg toward 56,000 and potentially the 58,000 area as forecast models project later in the month.
Volatility catalysts to track include the upcoming Bank of Japan policy commentary, JGB 10-year yield action, and any meaningful USD/JPY repricing — each of which can trigger sharp intraday swings on the Nikkei. Bots that respect predefined risk parameters tend to outperform discretionary trading during these high-headline windows.
Getting Started with Automated Nikkei 225 Trading
Putting this strategy into action takes only a few steps:
- Install the Trend Lines Bot on your MetaTrader 4 or MetaTrader 5 platform and connect it to a JP225 / Nikkei 225 CFD chart on your broker.
- Configure the bot's trend-line parameters around the 53,370 support and the 54,565 / 55,623 resistance levels identified in this analysis.
- Add the MA Distance Indicator to filter out trades where price is more than two standard deviations from the moving average.
- Backtest the configuration on Nikkei 225 historical data and validate slippage assumptions before deploying live.
- Activate the bot on a small position size first, scale up only after observing several clean executions during Tokyo and London sessions.
Need help fine-tuning the settings for your account size or risk profile? Reach out via our contact page — our team can walk you through optimal Nikkei 225 parameters and help you get the most out of the Trend Lines Bot setup.