NASDAQ 100 Pushes Toward 30,000 as Tech Rally Extends to Record Highs
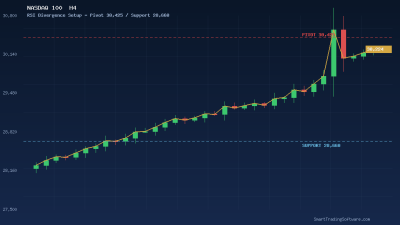
The NASDAQ 100 closed at 29,234 in early May 2026 and has carved out fresh all-time highs through the second week of the month, with the index trading firmly above the 29,000 level and gaining more than 2.5% over a two-session burst. Tech leadership has been relentless, fed by sustained AI capex tailwinds and an increasingly accommodative Fed narrative, putting the 30,000 psychological round number squarely in the spotlight.
Yet the chart is showing the first cracks in an otherwise pristine uptrend. RSI on the daily timeframe has pushed well above 70, locking the index into overbought territory, while the MACD is printing lower highs even as price prints higher highs — a textbook bearish momentum divergence. The pivotal medium-term support sits at 26,980, with a Fibonacci extension cluster acting as overhead resistance at 28,986/29,360 just below the round number. This is the kind of stretched-but-intact tape where a disciplined, signal-driven approach beats discretionary chasing.
Trading the 30,000 Test With a CCI Mean-Reversion Filter
The Commodity Channel Index (CCI) is purpose-built for this kind of market: trending higher, but flashing extremes. Rather than fading every overbought print, the setup is to wait for CCI to push above +200 into oxygen-thin territory, then watch for the first cross back below +100 to time a tactical short toward the 28,500/28,986 cluster — while keeping the structural uptrend bid for the eventual breakout above 30,000.
Entry Parameters
On the H4 chart, the trigger is a CCI(14) reading that first prints above +200 and then closes back below +100, ideally coinciding with price stalling in the 29,360–29,600 zone. A confirmation candle (bearish engulfing or pin bar) on H4 tightens the edge. For the bullish leg, the inverse applies: any pullback into 28,986 that produces a CCI oversold reversal above -100 is the higher-probability long toward 30,000.
Stop Loss and Take Profit
Short setups: place the stop 80 points above the high of the rejection candle, typically near 29,720. Take profit one at 28,986 (Fibonacci cluster), take profit two at 28,508 (medium resistance turned support). Long setups: stop below 28,800 (200 points), target one at 29,800, target two at the 30,000 round number. Risk-to-reward on both sides is at least 1:2.
Position Sizing and Risk
The NASDAQ 100 is generating intraday ranges of 250–400 points in this environment. Sizing should target a maximum 1% account risk per trade, with stops widened to the volatility, not narrowed to look pretty on a chart. With CPI on deck this week, partial profits at TP1 are non-negotiable.
Why Automation Wins in an Overbought-but-Bid Tape
The hardest part of trading a market like this is psychological — every overbought reading begs you to short the high, and every shallow dip begs you to chase the breakout. Automated execution removes both errors. A backtested expert advisor will only act when the exact CCI conditions trigger, ignoring the noise in between.
The CCI Bot implements precisely this kind of CCI-extreme reversal logic on MetaTrader 4 and 5, with configurable thresholds, confirmation candles, and built-in risk management so the bot trades the levels rather than the emotions. For traders who prefer a pure trend-following overlay during a strong uptrend, the Trend Lines Bot auto-draws the ascending channel and only takes longs on disciplined touches of the lower trend line — ideal for catching the eventual 30,000 breakout without overtrading the noise.
Before going live, a proper out-of-sample test is essential. The Indicators Tester lets you replay months of NASDAQ 100 H4 history against your CCI thresholds and stop logic so the parameters you ship to a live account are the ones that survived multiple market regimes — not just the bullish leg you remember.
Key Levels to Watch This Week
Resistance: 29,360 (Fibonacci extension), 29,600 (intraday swing), 30,000 (psychological round number), 30,500 (measured move from the April base). A clean daily close above 30,000 unlocks the next leg toward 30,500 and beyond.
Support: 28,986 (Fib cluster), 28,508 (broken resistance), 27,994 (recent breakout retest), 26,980 (medium-term pivotal). Loss of 26,980 on a closing basis would damage the uptrend structure and shift the dominant bias to neutral.
Macro catalysts: the Tuesday CPI print is the binary event of the week. A hotter-than-expected reading would lift yields and pressure tech valuations, accelerating any retracement toward 28,500. A cooler print clears the runway to 30,000 and likely triggers stop-driven momentum buying.
Getting Started With the Setup
If you want to put this strategy to work on a live or demo account, the workflow is straightforward:
1. Download and install the CCI Bot on your MetaTrader 4 or MetaTrader 5 platform.
2. Attach it to NASDAQ 100 (US Tech 100, NDX, or NAS100 depending on broker) on the H4 timeframe.
3. Configure CCI period to 14, upper threshold to +200, lower threshold to -200, and confirmation candle filter enabled.
4. Run a 12-month backtest in the Indicators Tester to validate the parameters across both trending and ranging regimes.
5. Start with micro-lot sizing on the live account and scale up only after 30 logged trades confirm the live results track the backtest.
The combination of the CCI Bot for tactical reversals and the Trend Lines Bot for trend continuation provides a balanced two-bot stack that can monetise both the breakout above 30,000 and the inevitable retracements along the way — without you having to be in front of the screen.
For tailored advice on which configuration fits your account size, risk profile, and broker, contact our team and a senior analyst will walk you through the setup personally.