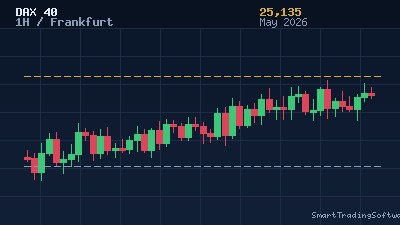
DAX 40 Holds Above 24,800 as Traders Eye January's 25,507 All-Time High
The German DAX 40 index is trading around 24,887 points in mid-May 2026, consolidating in a tight intraday band between 24,465 and 25,116 over the past sessions. After the index printed its record high of 25,507.79 on 13 January 2026, that level has acted as a firm ceiling on multiple retests, while bids have repeatedly stepped in near the 24,100 to 24,300 zone where the 100-day and 200-day simple moving averages cluster.
The structural picture is constructive. DZ Bank has flagged a year-end 2026 target of 27,500 points, citing controlled inflation below 2%, supportive ECB policy and resilient earnings in German industrials, tech and financials. Coin Price Forecast pencils in 25,894 by mid-2026 and 26,469 by year-end, while Long Forecast's May projection points to a 25,287 close inside a wide 21,603 to 27,057 monthly band. Volatility is back, but the trend remains positive — and that is exactly the kind of environment where mean-reversion entries combined with measured trend continuation can outperform.
Why the 25,507 All-Time High Is the Key Battleground
The January high is not just a chart number — it is the level where institutional sell orders previously absorbed every breakout attempt. A clean daily close above 25,507 would flip that supply pocket into demand and open the path to the classic R2 projection at 26,036, with secondary measured-move targets near 26,400. A failure to reclaim the high, however, would set up a deeper sweep of liquidity back into the 24,118 to 24,282 moving-average shelf.
For active traders, the practical question is how to position into both outcomes without over-leveraging the index. The cleanest approach is to fade extremes from the rising 50-period moving average while keeping a directional bias to the upside — and to automate the execution so that emotion does not interfere when the DAX gaps on a Monday open.
Trading the DAX 40 With the MA Distance Indicator
The MA Distance Indicator measures, in real time, how far price has stretched away from a chosen moving average. On an index like the DAX 40 — which tends to mean-revert intraday but trend cleanly on the daily — this distance metric is exceptionally useful for spotting overextensions before they snap back.
The core idea is simple: when price moves more than a defined threshold above the 50-period MA on the H1 chart, the probability of a short-term pullback rises; when price drops more than the threshold below the MA inside an uptrend, the probability of a continuation rally rises. The indicator quantifies that distance in points, percentage or ATR units, removing the guesswork from "is this stretched?"
H1 Entry Parameters for the Current Setup
With the DAX trading at 24,887 and the 50-period H1 MA estimated around 24,720, the indicator currently reads roughly +167 points of upside distance — moderate but not extreme. The entry plan for the days ahead is built around three scenarios:
Scenario A — Continuation toward 25,507. Long on a pullback that compresses the distance reading to within 30 points of the 50-period MA, ideally near 24,750. Entry trigger: bullish engulfing or pin bar on the H1 chart with the indicator turning back up. Stop-loss: 80 points below entry, just under 24,670. Take-profit 1 at 24,990, take-profit 2 at the all-time high of 25,507.
Scenario B — Breakout above 25,507. Long on a confirmed H4 close above 25,507 with the MA distance reading expanding rather than diverging. Stop-loss: 120 points below the breakout candle high, near 25,387. Take-profit 1 at 25,800, take-profit 2 at the R2 projection of 26,036.
Scenario C — Pullback to the moving-average cluster. If 24,800 fails on a daily close, the trade shifts to a counter-bounce setup at 24,118 to 24,282 where the 100-day and 200-day SMAs converge. The MA distance reading would need to print an oversold extreme on H1 of more than 200 points below the 50-period MA, signalling an exhaustion bottom.
Why Automation Helps in a Range-Then-Trend Index Like the DAX
Manual traders often miss the cleanest DAX setups because the index moves outside European retail hours — the cash-open gap at 09:00 CET and the US-session crossover at 15:30 CET are when most of the mean-reversion opportunities print. Layering an automated system on top of the indicator solves three problems at once: it monitors the distance reading on every tick, it places orders at exact pre-defined thresholds, and it manages risk consistently without revenge trading after a stop-out.
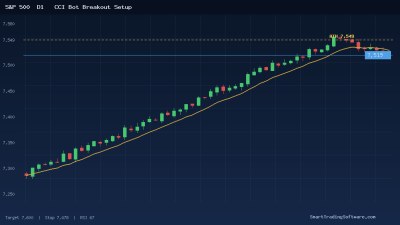
For the breakout side of the DAX, the Trend Lines Bot handles directional continuation cleanly. It draws dynamic trendlines from swing pivots and only fires entries on confirmed retests, which is ideal for trading the 25,507 breakout without getting chopped up by false moves. For the mean-reversion side — fading overextensions back to the 50-period MA — the CCI Bot pairs neatly with the distance indicator because CCI extremes typically align with maximum MA distance.
Key Levels to Watch This Week
Traders should mark these prices on the H4 and daily charts and let the indicator guide the timing:
Resistance: 25,116 (intraday range high), 25,287 (Long Forecast May close projection), 25,507 (January 2026 all-time high — the line in the sand), 26,036 (R2 projection on a confirmed breakout).
Support: 24,750 (50-period H1 MA — the first pullback zone), 24,465 (intraday range low), 24,282 (100-day SMA shelf), 24,118 (200-day SMA — short-term structure pivot), 23,921 (classic monthly pivot).
The 24,118 line matters most for risk management — a sustained daily close below it would weaken the short-term uptrend and shift the medium-term bias toward the 23,000 support zone that bulls have defended since February.
Getting Started With the DAX 40 Setup
To put this plan into action on MetaTrader 4 or MetaTrader 5, follow these steps:
1. Install the MA Distance Indicator on your DAX 40 chart and configure the moving average period to 50 on H1, with the distance threshold set to 30 points for trigger alerts and 200 points for exhaustion alerts.
2. Backtest the entry rules across the last six months of DAX data using the Indicators Tester. This will validate whether the 30-point pullback rule and 200-point oversold extreme actually produce edge on your broker's data feed.
3. Attach the Trend Lines Bot to a separate DAX 40 chart for the breakout scenario, configured to take only confirmed retests of the 25,507 zone with a 120-point stop and a 2:1 reward-to-risk profile.
4. Size positions conservatively. Even on a 27,500 year-end target, the path is unlikely to be linear — risk no more than 1% of account equity per trade and stagger orders rather than entering full size at a single level.
Need help configuring any of the tools above for a specific broker, account size or risk tolerance? Contact our trading desk and we will walk through the parameters with you before the next London open.