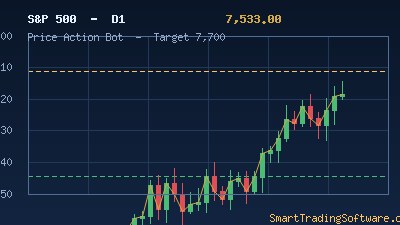
S&P 500 Tests 7,329 Resistance With Bullish Momentum Intact
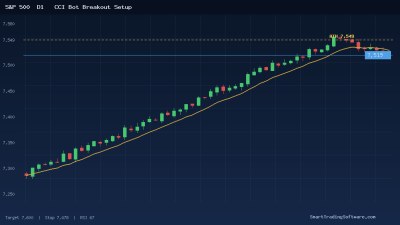
The S&P 500 continues to grind higher in May 2026, pressing against a well-defined resistance zone near 7,329 after a sustained recovery that began in early April. Price action has been remarkably constructive: a three white soldiers candlestick pattern formed between 6,574 and 7,143 launched the index into a clean bullish channel, and dips have repeatedly been bought at the rising trend line that now sits just above the 7,200 pivot.
Momentum is supportive but not yet stretched. The 14-period RSI is holding around 67, comfortably below the overbought threshold but indicative of strong buying pressure. MACD continues to expand in positive territory, and money flow indicators show steady liquidity inflows rather than the spikes that usually mark exhaustion. Traders watching the structure are now focused on a clear binary: a sustained break above 7,329 opens the 7,396 to 7,400 area as the next measured move, while failure here would invite a retest of the 7,200 to 7,163 demand zone.
Trading the 7,329 Breakout With a Trend-Following System
Breakout setups around well-defined horizontal resistance respond particularly well to a disciplined trend-following framework. The temptation in an uptrending index is to chase every green candle, but the cleaner edge sits in waiting for confirmation that buyers are willing to defend the breakout. That is exactly the kind of entry logic the Trend Lines Bot is designed to automate, anchoring decisions to moving-average alignment and dynamic trend-line geometry rather than impulse.
The plan below assumes a swing horizon of three to seven trading sessions, sized for daily ATR which currently sits near 48 index points on the S&P 500 cash index.
Entry Trigger
Wait for a daily close above 7,335 with the H4 chart showing price holding above the 21-period exponential moving average. A retest of 7,329 that prints a higher low on the H1 timeframe is the cleanest entry; otherwise, scale in on a daily close confirmation. Avoid chasing intraday spikes that fail to close above the level on the daily session.
Stop Loss
Place the protective stop at 7,196, just under the rising trend line and the prior swing low. That places initial risk at roughly 140 points from the trigger zone, which keeps risk-reward favourable when paired with the next targets.
Take Profit Zones
Scale out in stages. The first partial sits at 7,396, the cluster where prior intraday rejections occurred. The second target is 7,460, derived from the channel projection of the April-May leg. A runner can ride toward 7,543, which aligns with the upper LiteFinance bullish projection and the next major round-number magnet.
Why Automation Outperforms Manual Execution On Index Breakouts
Index breakouts are notorious for whipsaws around the daily close. A discretionary trader who jumps in at 7,335 during the European session can easily be shaken out by a 30-point intraday dip before New York closes the candle. An EA does not panic. It evaluates conditions at the close, fires the order, and manages the position by code. The Trend Lines Bot in particular is built around moving-average slope filters and trend-line geometry, so it naturally avoids countertrend entries that look tempting but historically lose.
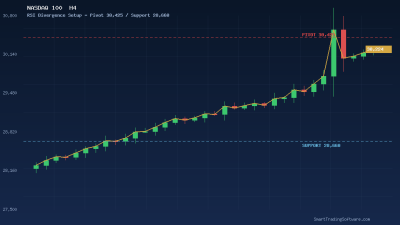
If your bias is that the index might fail at 7,329 and roll over toward the 7,163 pivot, a complementary tool worth considering is the RSI Divergence Bot. With RSI at 67 and price extending into resistance, hidden bearish divergence on H4 would be one of the first warnings that the buyers are losing the initiative. Running both systems on separate sub-accounts is a common approach for capturing both sides of an indecisive level.
Before committing live capital, the Indicators Tester can walk every signal through historical S&P 500 data. That kind of backtest matters more than usual at this point in the cycle, because momentum-led breakouts in late-stage trends behave differently from breakouts off oversold readings.
Key Levels To Watch This Week
The map for the next five sessions is unusually clean. On the upside, 7,329 is the immediate trigger, 7,396 is the first measured target, and 7,460 to 7,543 frames the next leg if momentum extends. On the downside, the 7,236 pivot is the line in the sand for short-term bulls. A daily close below 7,200 would invalidate the breakout thesis and shift focus to 7,163 and ultimately 7,112, where the next strong demand cluster sits.
Volatility expectations are also worth tracking. The VIX has compressed back below 14, which historically correlates with continuation in established uptrends but also raises the cost of complacency. A spike back above 16 alongside a rejection at 7,329 would be the cleanest combination signal for shifting bias to the short side.
Getting Started With Automated Index Trading
For traders who want to put this plan into action without staring at charts during the New York close, a structured setup keeps things simple.
1. Install MetaTrader 5 with a broker that offers reliable cash CFDs on the S&P 500 with low spreads during US session overlap.
2. Configure the Trend Lines Bot on the daily and H4 timeframes, focusing on the 7,329 breakout parameters described above.
3. Run an out-of-sample backtest in the Indicators Tester using data from January to April 2026 to validate the parameter set under the current volatility regime.
4. Start live execution with one-third of normal position size for the first two trades, scaling up only after the system confirms in real conditions.
5. Optionally, layer the MA Distance Indicator on the same chart as a visual confluence check; when price sits more than 2.5 ATRs above the 50-period MA, fade the entry size to manage mean-reversion risk.
The S&P 500 is approaching one of the most clearly defined technical decisions of the past month. Whether the next move is a clean breakout above 7,329 or a rejection back into the 7,163 demand zone, an automated framework removes the emotional bias that tends to plague discretionary index traders at exactly these moments. To discuss tailored automation for your account size and risk tolerance, get in touch with our team.