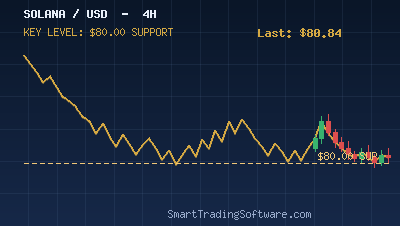
Solana Holds the $84 Floor as Bulls Eye the $91 Resistance
Solana is once again pressing against a familiar ceiling. SOL changes hands near $86 after defending the $84–$85 demand zone for the third week running, and the chart now sits squarely between two well-defined battle lines. The first is support around $84, reinforced by a rising 50-day moving average and the broader $75–$80 accumulation base that has absorbed every major sell-off since late winter. The second is resistance at $91, where supply has repeatedly capped advances over the past month and where short-term traders have been parking profit targets.
The setup is textbook range behaviour: the daily RSI sits near 53 (neither overbought nor oversold), the MACD is flattening, and volume is contracting into the apex. Historically, when SOL coils like this between layered support and resistance, the resolution tends to be sharp — and that is precisely the kind of move that automated trading is built to catch without hesitation.
Trading the SOL Range: A Support & Resistance Strategy
Rather than guessing the direction, the cleanest approach right now is a structured breakout-or-bounce play between the two well-known boundaries. The idea is simple: buy strength on a confirmed break of $91, or buy weakness on a clean rejection from the $84 floor. In both cases the risk is small, the reward is asymmetric, and the levels are obvious enough that an automated system can manage the entire trade.
Entry, Stop-Loss and Take-Profit Parameters
For the breakout leg, a long entry can be triggered on a 4-hour close above $91.20, with the initial stop placed below the prior swing at $87.80. The first take-profit sits at $95.50, the gap fill from late April, and the second target is the psychological $100 handle. For the range-bounce leg, longs can be staged between $84.20 and $84.80, with a stop just under $83.40 (the low of the consolidation) and a take-profit back at $89–$90. Either setup yields a risk-to-reward ratio of roughly 1:2.5 or better.
Position Sizing for a Volatile Asset
Solana still moves 4–6% on an average day, so position size has to respect that. Risking no more than 1% of account equity per trade keeps drawdowns manageable even if the $84 floor finally cracks and price flushes toward the $76 swing low. Traders running multiple correlated crypto positions (BTC, ETH, SOL together) should scale that risk down further, since these markets tend to move in lockstep on macro headlines.
Why Automation Wins in a Range Like This
Range trading is mechanically simple but emotionally brutal. The price spends days drifting sideways, then breaks out at 3 a.m. on a Sunday after a token unlock or an unexpected ETF headline. Discretionary traders miss those moves; algorithms do not. The Support & Resistance Bot is purpose-built for exactly this kind of structure — it monitors user-defined horizontal levels, waits for confirmed breaks or rejections, and executes with predefined stops and targets, all without requiring the trader to be in front of the screen.
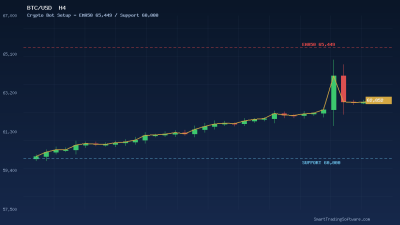
For traders who want a more crypto-specific engine, the Crypto Bot applies a tuned multi-indicator filter to digital assets and works well on SOL, BTC and ETH thanks to its volatility-aware position sizing. And before deploying any strategy with real capital, the Indicators Tester lets you backtest the exact $84/$91 logic across years of historical SOL data to confirm the edge is real and not a recency illusion.
Key Levels to Watch This Week
Several price points will dictate what happens next on the SOL chart. To the upside, $88 is the local pivot — a clean break above it usually precedes a test of $91. Above $91, the path opens toward $95.50 and then the round number at $100, which has not been reclaimed since the early-spring correction. To the downside, $84 is the line in the sand. A daily close below it would invalidate the bullish range thesis and shift focus to $80, with the deeper $76 swing low as the next major demand pocket.
Watch BTC dominance alongside SOL. If Bitcoin breaks higher and dominance falls, alts (Solana included) tend to outperform on the upside. If dominance rises while BTC stalls, SOL is more likely to bleed back toward $80 even without bad news of its own.
Getting Started With the SOL Range Setup
Putting this trade to work on MetaTrader takes only a handful of steps:
- Open SOL/USD on the H4 chart and mark the $84 support and $91 resistance with horizontal lines.
- Install the Support & Resistance Indicator to auto-detect the secondary levels (the pivots at $88 and $89–$90).
- Run a 12-month backtest of the breakout-and-bounce logic in the Indicators Tester to confirm hit-rate and average R-multiple.
- Deploy the Support & Resistance Bot on a demo account first, with the levels and risk-per-trade set to match the parameters above.
- Once the bot is firing entries cleanly, switch to a live account — but keep size small for the first two weeks while you observe execution under real liquidity conditions.
SOL between $84 and $91 is one of the cleaner setups on the crypto board this week. Whether the next leg is the breakout or the bounce, the levels are doing the work for you — the only real edge left is removing emotion from the entry. If you want help mapping the right bot to your account size and broker, contact our team and we will walk you through the setup.