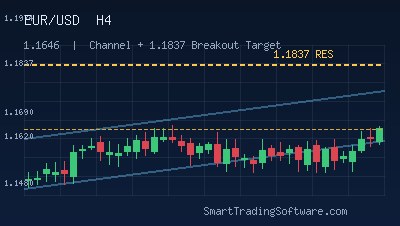
EUR/USD Tests 1.18 Resistance After Holding 1.1680 Support
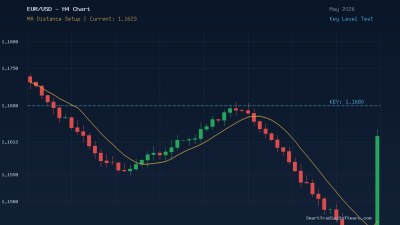
EUR/USD is consolidating near 1.1750 in early May 2026, trading inside a well-defined range that has formed after the pair recovered from the March low at 1.1476. Price has held firmly above the 1.1680 confluence zone, where prior support and the 200-day moving average converge, while repeated tests of the 1.1800 region have so far failed to deliver a clean breakout. The structure looks textbook for a rules-based range strategy, with bulls defending the lower boundary and sellers fading every push toward the upper one.
The technical backdrop favors moderate euro strength, but the pair still needs a decisive close above the 1.1974 to 1.2000 zone before the broader bullish case becomes dominant. Until that happens, EUR/USD is likely to keep oscillating between roughly 1.1680 and 1.1800, occasionally extending to 1.1850 on stronger moves. For traders, this is a market that rewards patience and disciplined execution far more than directional conviction, which is exactly the type of environment where automated support and resistance strategies tend to perform best.
Trading the EUR/USD Range with the Support & Resistance Bot
The current price action sets up cleanly for the Support & Resistance Bot, an MT4/MT5 expert advisor that automates entries off pre-defined horizontal zones using configurable rejection logic. Rather than chasing breakouts, the strategy fades extremes inside the established range and lets the structure do the heavy lifting. With EUR/USD respecting both ends of the 1.1680 to 1.1800 corridor for several sessions in a row, the bot can cycle through multiple round-trip trades while the range holds intact.
Long Setup Off 1.1680 Support
The primary long entry sits around 1.1685 to 1.1700, scaling in on bullish rejection candles in the New York or London sessions. A protective stop below 1.1640 keeps the trade safe from a stop-run on the 200-day moving average. The first take-profit is set at 1.1780, just below the 1.1800 resistance, with a second partial at 1.1845 if momentum extends. The risk-to-reward on the first target is roughly 1:2, with the second leg pushing toward 1:3.5.
Short Setup at 1.1800 Resistance
For the bearish leg of the range, the bot can short into 1.1795 to 1.1810 on a bearish engulfing or pin-bar rejection. Stops belong above 1.1860, beyond the failed-breakout cluster, and the first target is back at 1.1700 with a stretch target at 1.1655. Both legs use ATR-based trailing stops once price moves halfway to the first take-profit, which protects gains if EUR/USD stalls inside the range.
Why Automation Beats Manual Execution in Range Markets
Range trading sounds simple in theory, but in practice it punishes hesitation. The best entries form during off-hours, the rejection candles need to be confirmed and acted on within minutes, and traders frequently second-guess themselves after one losing trade. The Support & Resistance Bot removes that friction by executing the plan exactly as configured, every time, without emotional drag. Combined with the Support & Resistance Indicator, you can visualize the same zones the bot is trading from, which makes oversight and parameter tuning straightforward.
Before going live, every parameter should be validated on historical data. The Indicators Tester lets you run the bot's signal logic across years of EUR/USD price action, so you can see how the strategy would have performed during ranging phases in 2024 and 2025 versus during the trending breakouts that occasionally interrupt them. Optimizing the rejection-confirmation threshold and the partial-exit ratio on real history is one of the highest-leverage things a discretionary trader can do.
Key EUR/USD Levels to Watch This Week
On the upside, 1.1800 remains the line in the sand. A daily close above it opens the path to 1.1850 and then the bigger 1.1974 to 1.2000 cluster, which has rejected price multiple times since January. A clean break above 1.2000 would shift the bias from range trading to trend following and likely invalidate any short setups inside the current zone.
On the downside, 1.1680 is the level that holds the entire structure together. A break and daily close below 1.1675 exposes 1.1550 next, with the March low at 1.1476 sitting underneath as the major capitulation target. Until either of those breaks confirms, the working assumption is that EUR/USD will continue to mean-revert inside the established corridor.
Getting Started with EUR/USD Range Automation
If you want to deploy this setup on your own terminal, the workflow is straightforward:
- Download and install the Support & Resistance Bot on your MT4 or MT5 platform.
- Configure the long zone at 1.1680 to 1.1700 and the short zone at 1.1795 to 1.1810, with stops and targets matching the parameters above.
- Backtest the configuration in the Indicators Tester using EUR/USD H1 or H4 data from 2024 onward.
- Run the bot on a demo account for at least one full week before going live, especially around major ECB or Federal Reserve announcements.
- Monitor the 1.1680 and 1.1800 boundaries daily and disable the bot if either side breaks decisively.
EUR/USD is offering one of the cleanest range-trading setups of the year, but the edge only pays out if execution stays mechanical. If you want help configuring the parameters or sizing the trade for your account, reach out via our contact page and our team will walk you through it.