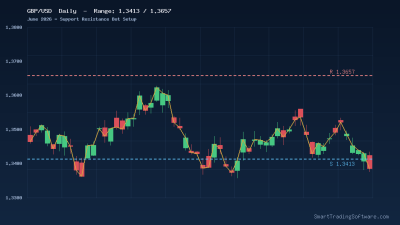
GBP/USD Tests 1.3622 Pivotal Resistance as Cable Eyes 1.3725 Projection
Cable has clawed its way back to the 1.3620 region, knocking on the door of the pivotal 1.3622 resistance level after closing higher on May 8, 2026. The pair printed 1.3620 at the latest session, up roughly 0.60% on the day, and the path of least resistance now skews bullish so long as the rising 30-day SMA at 1.34538 holds beneath price. A confirmed daily close above 1.3622 opens the runway toward the 61.8% Fibonacci projection at 1.3725, with the February peak near 1.3850 and the 1.4000 psychological barrier as the longer-term targets traders are already pencilling in.
The fundamental backdrop is unusually supportive for sterling. The Bank of England's hawkish 8-1 hold at 3.75% on 30 April, paired with the central bank's explicit guidance that policy "would need to lean against" second-round inflation effects, has tilted rate-differential math in the pound's favour. Across the Atlantic, the Federal Reserve's deeply divided 8-4 vote to hold the fed funds rate at 3.50-3.75% on 29 April – the most fractured FOMC decision since October 1992 – has muddied the dollar's outlook. Markets are now pricing in as many as two further BoE hikes by year-end, while Fed pricing remains noisy. That divergence is exactly the kind of macro tailwind that fuels sustained directional moves in cable.
Trading the 1.3622 Breakout: A Multi-Timeframe RSI Strategy
The cleanest setup currently on the chart is a momentum-driven breakout play built around the RSI indicator across multiple timeframes. On the hourly chart, RSI is sitting in the mid-60s with a fresh bullish MACD crossover, and the SMA(60) at 1.35954 has flipped from resistance to a reliable floor. On the daily, RSI is reading just above 58 and rising, which is the textbook condition for a continuation breakout out of an ascending channel. The H4 timeframe is the tiebreaker: as long as H4 RSI holds above 50 on every retracement, the structure remains constructive.
The trade thesis is simple. Wait for an hourly close above 1.3622 with H4 RSI above 50 and daily RSI confirming directional alignment. Then enter on the first pullback to the broken resistance, which now becomes support. This is precisely the kind of confluence-driven entry that a retail trader can execute manually, but it is also the kind of setup that benefits enormously from automation, because the RSI alignment between three timeframes can disappear in minutes.
Entry Parameters
Aggressive entry is on the breakout candle close above 1.3625, with confirmation that hourly RSI has crossed above 60 and is rising. Conservative entry is on a 38.2% Fibonacci retracement of the breakout impulse, typically landing in the 1.3608-1.3615 zone, provided H4 RSI has not dipped below 50 during the pullback. Either entry should be taken only when the daily timeframe is also showing RSI above 55 on a closing basis.
Stop Loss and Take Profit
The logical invalidation level is a daily close back below 1.3580, which would void the breakout structure and put the rising 30-day SMA at risk. A tighter stop for active traders is 1.3565, just below the recent intraday swing low. The first take-profit target is 1.3710-35, the next major resistance cluster, where partial profits should be locked in. The second target is 1.3850, the February peak. Traders running larger position sizes can leave a runner with a trailing stop targeting the 1.4000 round number.
Why Automation Beats Manual Execution on Multi-Timeframe Setups
Multi-timeframe RSI strategies look elegant in hindsight, but they are notoriously hard to execute by hand because the alignment windows are short, often less than an hour, and they require constant monitoring of three separate charts at once. Missing the window by even a few candles can mean entering at a worse price or, more often, missing the trade altogether.
The RSI Multi-Timeframe Bot is built specifically for this kind of setup. It evaluates RSI conditions on multiple timeframes simultaneously and only fires an order when all configured conditions align – exactly the discipline this GBP/USD breakout demands. Combined with the MA Distance Indicator, which measures the distance between price and the 30-day SMA, traders can filter out late entries when price has already extended too far from its mean.
For traders who prefer to validate the strategy before risking live capital, the RSI Multi-Timeframe Tester allows full backtesting of multi-timeframe RSI logic against years of historical GBP/USD data, so you can quantify drawdowns, win-rates, and average risk-reward before going live.
Key Levels to Watch on GBP/USD
The chart structure right now is unusually clean, with well-defined zones above and below current price. Pivotal resistance sits at 1.3622, the level the pair is currently testing. Above that, the next obstacle is 1.3657, a former intraday top, followed by the 61.8% projection at 1.3725 and the broader 1.3710-35 cluster. The February high at 1.3850 is the medium-term magnet on a sustained breakout, with 1.4000 as the longer-term psychological barrier.
Beneath spot, immediate support is the SMA(60) at 1.35954, then the recent swing low at 1.3580. The first major support zone is 1.3485, where the pair has previously found bids, and the 30-day SMA at 1.34538 reinforces that area. A daily close below 1.3453 would call the entire bullish channel into question and shift the medium-term bias back toward the broad 1.30-1.32 floor that has held throughout the year.
Getting Started With the Cable Breakout Setup
Traders who want to participate in this GBP/USD setup with rule-based execution can follow these steps:
1. Install the RSI Multi-Timeframe Bot on your MetaTrader 4 or 5 platform and configure it for H1, H4, and D1 RSI alignment with the thresholds described above (H1 above 60, H4 above 50, D1 above 55).
2. Add the MA Distance Indicator to your GBP/USD chart and set a maximum acceptable distance from the 30-day SMA to avoid chasing extended moves.
3. Run a 12-month backtest in the RSI Multi-Timeframe Tester to confirm that the parameter set produces a positive expectancy on cable specifically before deploying live.
4. Set entry to 1.3625 with a stop at 1.3580 and staged take-profits at 1.3725 and 1.3850. Position size so that the worst-case loss represents no more than 1% of account equity.
5. Monitor the BoE and Fed communications calendar – any dovish surprise from the BoE or hawkish surprise from the Fed could rapidly invalidate the setup, and the bot should be paused around those releases.
If you would like a personalised walk-through of the configuration or want to discuss custom parameters for your account size and risk profile, get in touch through our contact page and one of our analysts will respond within one business day.