XRP at $1.38 After a 39% Two-Day Surge — and the RSI Is Screaming
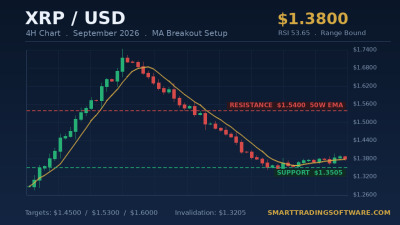
XRP is trading around $1.38 on Friday, 21 August 2026, after one of the sharpest short-term recoveries the token has produced this year. Between 19 and 21 August the price ran from roughly $1.00 to just under $1.40 — a gain of about 39% in two sessions — with intraday highs tagging $1.42 before sellers stepped in.
The move did real technical damage to the bear case. XRP broke above a year-long descending trendline and closed back above its 200-day exponential moving average at $1.34, erasing the death cross that had hung over the chart for months. On any longer-term reading, the structure is now intact again.
The problem is what the move cost in momentum terms. The daily RSI is pinned at 82.82, one of the most stretched readings XRP has printed in years. Some feeds put it closer to 77, but the message is the same either way. Price is trading above the upper daily Bollinger Band at $1.25 and sits roughly 27% above the 20- and 50-day EMAs, which are clustered near $1.09. Only a session earlier, on 20 August, XRP closed at $1.19 with a daily RSI of 72.39 — already overbought before the final leg higher.
Vertical moves like this rarely end with a clean continuation. They end with either a sharp mean-reversion snap or a multi-week sideways grind while the moving averages catch up. Both scenarios favour the same class of setup: bearish RSI divergence into resistance.
The Overbought Pullback Strategy: Trading Bearish RSI Divergence on XRP
Bearish RSI divergence occurs when price prints a higher high while the RSI prints a lower high. It signals that the buying pressure behind the second push is weaker than the first, even though the chart still looks strong. With the RSI above 80, the odds of that second push failing are meaningfully elevated.
The setup here is not a blind short into strength. That is how traders get run over in a trend this powerful. The trade is to wait for XRP to attempt the $1.40–$1.43 resistance band a second time, confirm that the RSI fails to exceed its prior peak, and only then look for a short entry with a defined invalidation.
Entry Trigger
Use the 4-hour chart as the signal timeframe and the daily as the trend filter. Wait for XRP to make a higher high above $1.42 while the 4-hour RSI(14) prints a lower high than its previous swing peak. Enter short on the close of the first 4-hour candle that closes back below $1.40 after the divergence forms. If the divergence never confirms, there is no trade — that discipline is the entire edge.
Stop Loss Placement
Place the stop above the divergence high plus a volatility buffer. With XRP's current 4-hour ATR running hot after the surge, use 1.5x ATR above the swing high rather than a fixed pip figure. In practice that puts the stop somewhere in the $1.46–$1.50 region — above the upper edge of the $1.38–$1.46 resistance zone and above the psychological $1.50 line where a genuine breakout would be confirmed.
Take Profit Targets
Scale out rather than aiming for a single exit. The first logical target is the 200-day EMA at $1.34, which flipped from resistance to support on the breakout. Take a third there. The second target is the reclaimed $1.22–$1.25 zone, which coincides with the upper Bollinger Band and the level XRP had to clear to trigger this rally. Take another third there. Let the final third run toward the $1.09 EMA cluster, trailing behind the 4-hour swing highs.
Position Sizing and Filters
Risk no more than 1% of account equity per attempt, and cap the strategy at two attempts. If both divergence signals fail, the trend is stronger than the momentum reading suggests and the setup is void. Add a hard filter: do not take the short if Bitcoin is simultaneously breaking to new highs, because correlated crypto strength will overwhelm any single-asset divergence signal.
Why Automation Handles This Better Than You Do
Divergence is deceptively hard to trade manually. The signal appears on a specific candle close, often at an inconvenient hour, and it requires comparing two RSI swing peaks against two price swing peaks with consistent rules about what qualifies as a swing. Most traders either see divergence everywhere or miss it entirely, and almost nobody applies the same definition twice in a row.
The STS RSI Bot removes that inconsistency. It applies your RSI thresholds and swing rules identically on every bar, watches the levels while you are away from the screen, and executes with predefined stop and target parameters — including the ATR-based stop and the partial-exit structure described above.
Timeframe alignment is the other half of the problem. This setup needs the 4-hour RSI for the signal and the daily RSI for the trend filter, and flipping between charts is where mistakes creep in. The STS RSI MTF Indicator puts both readings on a single chart, so you can see at a glance whether a 4-hour divergence is forming while the daily is still pinned above 80.
Before committing capital, run the parameters through the STS RSI Tester. It lets you replay your RSI settings against XRP's historical data and see how the rules would have performed through previous overbought spikes — including the ones that kept going. That last category matters most, because it tells you what your realistic loss rate looks like.
Key XRP Levels to Watch
Resistance sits first at $1.40–$1.43, the immediate ceiling that has capped the current push. Above that, $1.46 marks the upper edge of the broader resistance region, and a decisive daily close above $1.50 would invalidate the pullback thesis entirely and open a genuine continuation leg.
On the downside, $1.34 is the line that matters most in the short term — the 200-day EMA and the level that turned the death cross into a bullish signal. Losing it on a daily close would suggest the breakout was a liquidity grab rather than a trend change. Below there, $1.22–$1.25 is the reclaimed breakout zone and the first area where dip buyers should be expected to defend. The $1.09 EMA cluster is the deeper mean-reversion target, and $1.01 remains the structural line: a loss of $1.01 would break the support structure entirely and expose $0.95.
Context matters too. XRP ETF inflows have stayed weak, which has capped institutional bid support, while progress on the CLARITY Act has been the main narrative driver behind the rally. Bitcoin holding above $60,000 remains the broader condition for altcoin strength — if BTC cracks, XRP's divergence setup gets a tailwind it did not need.
Getting Started
- Open XRP/USD on MetaTrader 4 or MetaTrader 5 and set up 4-hour and daily charts side by side.
- Add RSI(14) to both timeframes — or use the STS RSI MTF Indicator to see both at once — and mark the current swing peaks as a reference for the divergence comparison.
- Mark the levels above — $1.50, $1.46, $1.43, $1.34, $1.25, $1.09, $1.01 — as horizontal lines on the chart.
- Load the STS RSI Bot onto the 4-hour chart in a demo account first.
- Backtest the configuration with the STS RSI Tester across at least two previous XRP volatility cycles before going live.
- Set risk to 1% per trade, enable the ATR stop, and configure the three-stage partial exit.
- Run it in demo through at least one full signal cycle. Only then move to a funded account.
An RSI reading above 80 is not a sell signal on its own — strong trends stay overbought far longer than most traders can stay solvent shorting them. What it is, is a condition that makes divergence signals far more reliable when they do appear. The discipline is in waiting for the confirmation and in sizing so that being early does not become being wrong.
If you want help matching the right bot to your account size, broker, and risk tolerance, get in touch with our team and we will walk you through the setup.