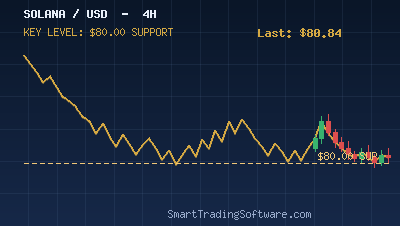
Solana Coils Between $80 Support and $93 Right Shoulder
Solana (SOL) is trading near $85 in late April 2026, locked in a consolidation range between the $80 floor and the $93 right shoulder high that has framed price action for most of the month. The 0.618 Fibonacci retracement at $85 sits right on top of the 20-day EMA near $86, creating a tight pivot zone that bulls and bears keep contesting on every session. With the RSI parked at 51.57 and the MACD on the verge of a bullish crossover, neither side has decisively claimed control yet — but the longer SOL coils inside this $77 to $94 range, the more violent the eventual breakout is likely to be.
The macro tape is feeding both narratives. Spot SOL ETFs continue to log strong weekly inflows, with Goldman Sachs disclosing a sizable position that several desks are reading as a tradfi endorsement of the chain. On the other hand, the $285 million Drift Protocol exploit earlier in April rattled DeFi confidence and pulled a measurable amount of TVL out of Solana-native protocols. The result is a market that respects the technical levels almost too cleanly — every bounce stalls at $86, every dip gets bid at $80.
Why a Swing-Pivot Strategy Fits the Current SOL Tape
Time-based candles on the 1H and 4H Solana chart are noisy. Wicks pierce the $80 support and the $86 EMA dozens of times per day without any of those moves committing to a real direction, and that is exactly the kind of environment where a swing-pivot filter shines. By only registering a new pivot when price reverses by a fixed minimum percentage, a Zig Zag-style filter strips the chop out and lets the underlying swing structure show through cleanly.
For SOL at this volatility regime, a deviation threshold of roughly 1.4 percent — about $1.20 at current prices — does a good job of separating real swings from noise. A confirmed pivot at $80 or $93 carries far more information than any single 1H candle close, because it requires sustained directional pressure rather than a single algorithmic spike. That makes the setup tradable with mechanical rules instead of subjective chart reading.
Entry Trigger
The base trade is a swing reversal at the boundaries of the consolidation. A long signal fires when a confirmed bullish pivot prints inside the $80 to $81.50 demand band — that is the zone where the recent swing low and the 1.382 Fibonacci extension off the April low overlap. A short signal fires when a confirmed bearish pivot prints inside the $92.50 to $94 supply band, which captures both the right shoulder high near $93 and the upper Bollinger band that has rejected price four times this month.
Stop and Target
Stops sit just beyond the pivot — roughly $1.50 below the entry pivot for longs, $1.50 above for shorts. The first target for longs is the $86 to $87.20 zone (20-day EMA plus 0.5 Fibonacci), with a stretch target at $92.80 if the breakout extends. For shorts, the first scale is $82.40 (mid-range), with the runner target at $76.80 just above the 1.618 Fibonacci confluence at $73. That structure produces a base reward-to-risk near 2.5:1 on the first target and well above 4:1 on the runner, which is the kind of skew that survives a sub-50% win rate.
Where Automation Earns Its Keep
Range trading at this scale is mechanical work. The hard part is not identifying the levels — they are visible to anyone with a chart — it is sitting in front of MetaTrader long enough to catch the swing reversal when it actually prints, then executing without hesitation. SOL trades 24/7, the cleanest reversals tend to print during low-volume hours, and most discretionary traders end up either missing the trigger or overriding it on the third or fourth tag of a level when fatigue sets in.
That is exactly the workflow our STS Zig Zag Bot was built for. The EA tracks swing pivots from broker tick data and executes the reversal logic above without subjective input. For traders who want to layer in the moving-average confluence explicitly, our STS MA Touch Bot fires when price reconnects with a configured MA — meaningful at $86 where the 20-day EMA has acted as the recurring pivot, and pairable with the Zig Zag trigger to filter trades to only those occurring at qualified MA tags.
Key Levels to Watch in the Coming Sessions
The map for the next one to two weeks is simple. On the upside, $86 (20-day EMA) is the first inflection, then $92.80 to $93 (right shoulder + upper Bollinger), and finally the $100 psychological level that has capped every rally since February. A sustained 4H close above $93 would invalidate the head-and-shoulders read and open the door toward the $108 to $112 measured-move target.
On the downside, $80 is the must-hold for the consolidation thesis. A clean 4H close below $79.50 turns the pattern into a distribution top and exposes $76 first, then the $73 1.618 Fibonacci. Below $73 the chart turns structurally bearish and the next demand zone sits near $66. Until either $93 or $80 breaks, the playbook is to fade the edges and avoid the middle of the range.
Getting Started With the Swing Setup
The simplest way to act on this analysis without committing live capital first is to validate the rules on past SOL price action. To do that:
- Install the STS Zig Zag Tester in your MetaTrader setup and load the SOL/USD or SOL/USDT symbol from your broker.
- Configure a 1.4 percent deviation and replay the last 60 days of price action to confirm the pivot reversal logic survives the recent volatility regime.
- Once the rules hold up in the replay, deploy the STS Zig Zag Bot to a demo account and tune the deviation for your broker's tick feed before any live size goes on.
- Move to live execution only after at least two weeks of demo performance that matches the backtest envelope.
If you are not sure which configuration fits your account size or broker spread, the team is happy to walk through it. Reach out via the contact page with your timeframe and account details, and we will send back a parameter set sized to your setup.