Ethereum Hovers at $2,318 as Bulls Defend the 200-Day Moving Average
Ethereum is consolidating around $2,318 in early May 2026, sitting just below the 200-day moving average at $2,345 and the 50-day moving average at $2,322. The 14-day RSI is reading 35.05 — a level traders watch closely because it sits at the edge of oversold territory without committing to it. The MACD is still negative, but the slope has flattened, and the higher low printed against the late-April swing at $2,211 is the kind of structural clue swing traders look for when sentiment is bearish but momentum is fading.
The wider context is constructive. May has historically been one of Ethereum's most volatile months, and analyst consensus places the May 2026 range between $2,200 and $2,700, with $2,550 as the median target. ETF inflows have stabilized after April's sell-off, and on-chain data shows accumulation by mid-sized wallets in the $2,250–$2,330 zone. None of that guarantees a bounce, but it does explain why the $2,300 level is being defended on every probe lower.
Why ETH Around $2,300 Is a Crypto Bot Setup, Not a Discretionary Trade
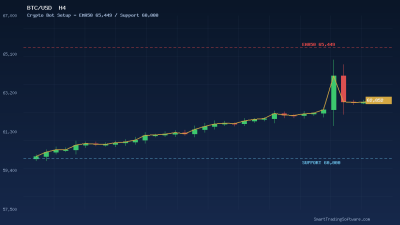
The current ETH structure has every characteristic that automated strategies handle better than humans: a tight consolidation under a major moving average, repeated tests of the same support, low realised volatility relative to the implied range, and the constant temptation to anticipate a breakout one bar too early. Our Crypto Bot is built specifically for these phases. It uses a multi-confirmation engine — moving average alignment, RSI filter, and volume validation — so it does not chase the first candle that pokes through resistance.
The strategy logic for the current ETH chart is straightforward. The bot waits for a four-hour close above $2,345 (the 200-day MA), confirms that the RSI has crossed back above 40 from below, and only then opens a long position. Conversely, a four-hour close beneath $2,211 with RSI rolling below 35 would flip the bias short. The point of automation is that the bot does not negotiate with itself when the price wicks into either zone — it executes or it stands aside.
Entry Trigger
Long entry is staged on a confirmed four-hour close above $2,345 with RSI > 40 and volume above the 20-period average. A more aggressive variant enters on a retest of $2,322 (50-day MA) after the breakout, which usually offers a tighter risk profile.
Stop Loss and Take Profit
Initial stop loss sits at $2,275, just below the consolidation floor. The first take profit clusters around the recent swing high at $2,420; the second target is $2,500, which lines up with the descending trendline from the March top and the lower bound of the analyst range. A trailing stop activates after the first target is reached, locking in roughly 60% of the move while leaving room for a continuation toward $2,700.
The Case for Letting Software Trade This Setup
ETH at the 200-day moving average is the kind of decision point that punishes hesitation in either direction. Manual traders tend to do one of two things: enter too early on the first hopeful candle, or wait for so much confirmation that the move is half-spent before they buy. A rules-based system removes both failure modes. The Crypto Bot only acts when its filters agree, and it sizes positions with a fixed risk-per-trade rule, so a single wrong call cannot cascade into a series of revenge trades.
Before deploying any logic to a live account, however, every parameter needs to be stress-tested against historical data. Our Indicators Tester lets you replay the last 12 months of ETH four-hour candles and see exactly how a given RSI threshold or moving-average filter would have performed across the post-halving regime. You can compare a 200-MA breakout strategy against a simple support-bounce strategy on the same data and pick the one that matches your risk tolerance, not the one that sounds best in a YouTube video.
Key Ethereum Levels to Watch This Week
The map for the next five sessions is unusually clean. To the upside, the first hurdle is $2,345 (200-day MA), then $2,420 (April swing high), then the psychological $2,500 — which also happens to be the lower bound of the May analyst range. To the downside, $2,300 is the round-number magnet, $2,275 is the consolidation floor, $2,211 is the late-April swing low, and a clean break of that opens the path to $2,108 and ultimately the $1,909–$1,741 demand zone that printed during the summer of 2025.
The single most important number remains $2,345. As long as ETH is closing four-hour bars beneath that level, the structure stays bearish-to-neutral and rallies should be sold into resistance. A daily close back above $2,345 — confirmed by RSI above 50 — would be the first real signal that the April downtrend has exhausted itself and the path of least resistance has flipped.
Getting Started With ETH Automation in 5 Steps
If you want to trade this setup without staring at the four-hour chart for the next two weeks, the workflow is short:
- Backtest the parameters on the last 12 months of ETH data using our Indicators Tester.
- Pick the parameter set that matches your drawdown tolerance, not just the one with the highest return.
- Install the Crypto Bot on a demo MT5 account and run it for at least two weeks across the current consolidation.
- If the demo performance matches the backtest within tolerance, deploy to a live account with no more than 1% risk per trade.
- Review weekly: the bot does not need supervision, but the strategy thesis does.
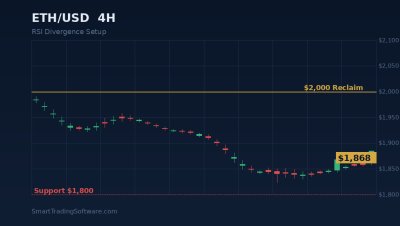
For the indecisive phase Ethereum is currently in, you can also pair the Crypto Bot with our RSI Divergence Bot on a separate sub-account. The two systems take fundamentally different signals — one trades the breakout, the other trades the exhaustion — and the combined equity curve has historically been smoother than either run alone.
Have a question about which configuration fits your account size or your broker's spread profile? Reach out via our contact page and our team will walk you through the setup before you commit any capital.